|
Download Data (XLS File) |
|
||||||||
|
||||||||
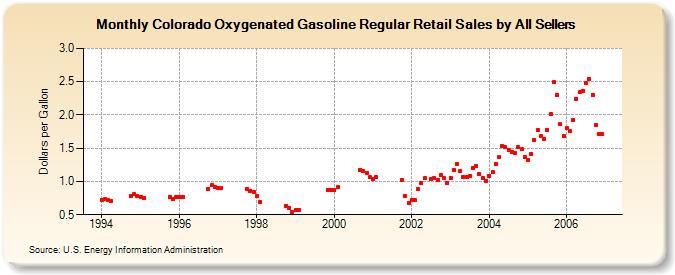
| Colorado Oxygenated Gasoline Regular Retail Sales by All Sellers (Dollars per Gallon) | ||||||||
| Year | Jan | Feb | Mar | Apr | May | Jun | Jul | Aug | Sep | Oct | Nov | Dec |
|---|---|---|---|---|---|---|---|---|---|---|---|---|
| 1994 | 0.717 | 0.729 | 0.715 | 0.708 | W | W | W | NA | W | 0.787 | 0.808 | 0.779 |
| 1995 | 0.772 | 0.755 | W | W | W | W | W | W | W | 0.761 | 0.742 | 0.763 |
| 1996 | 0.769 | 0.770 | NA | W | - | - | - | - | W | 0.894 | 0.941 | 0.913 |
| 1997 | 0.904 | 0.898 | W | W | W | W | W | W | W | 0.889 | 0.863 | 0.847 |
| 1998 | 0.774 | 0.690 | - | - | - | - | - | - | - | 0.634 | 0.603 | 0.540 |
| 1999 | 0.569 | 0.574 | NA | W | W | W | - | - | - | W | 0.871 | 0.876 |
| 2000 | 0.869 | 0.915 | W | W | W | W | W | W | 1.178 | 1.160 | 1.131 | 1.064 |
| 2001 | 1.040 | 1.064 | NA | NA | W | W | W | W | W | 1.019 | 0.788 | 0.676 |
| 2002 | 0.717 | 0.714 | 0.881 | 0.981 | 1.047 | NA | 1.037 | 1.054 | 1.020 | 1.093 | 1.045 | 0.975 |
| 2003 | 1.056 | 1.172 | 1.255 | 1.153 | 1.072 | 1.066 | 1.075 | 1.208 | 1.234 | 1.109 | 1.055 | 1.013 |
| 2004 | 1.086 | 1.135 | 1.268 | 1.366 | 1.531 | 1.516 | 1.474 | 1.447 | 1.426 | 1.513 | 1.484 | 1.375 |
| 2005 | 1.326 | 1.414 | 1.624 | 1.771 | 1.688 | 1.641 | 1.778 | 2.008 | 2.488 | 2.296 | 1.857 | 1.681 |
| 2006 | 1.796 | 1.754 | 1.924 | 2.246 | 2.343 | 2.367 | 2.477 | 2.545 | 2.302 | 1.848 | 1.708 | 1.707 |
| - = No Data Reported; -- = Not Applicable; NA = Not Available; W = Withheld to avoid disclosure of individual company data. |
| Release Date: 6/1/2022 |
| Next Release Date: TBD |