|
Download Data (XLS File) |
|
||||||||
|
||||||||
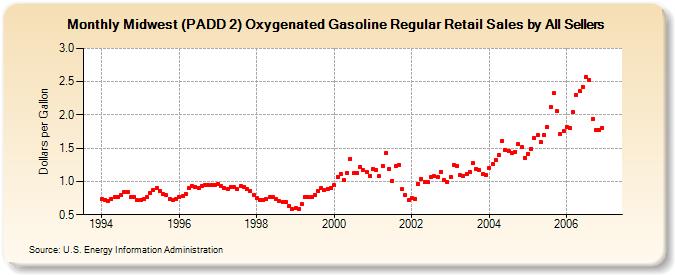
| Midwest (PADD 2) Oxygenated Gasoline Regular Retail Sales by All Sellers (Dollars per Gallon) | ||||||||
| Year | Jan | Feb | Mar | Apr | May | Jun | Jul | Aug | Sep | Oct | Nov | Dec |
|---|---|---|---|---|---|---|---|---|---|---|---|---|
| 1994 | 0.731 | 0.722 | 0.710 | 0.737 | 0.760 | 0.771 | 0.796 | 0.848 | 0.848 | 0.767 | 0.767 | 0.714 |
| 1995 | 0.720 | 0.730 | 0.769 | 0.823 | 0.874 | 0.900 | 0.850 | 0.809 | 0.792 | 0.736 | 0.724 | 0.740 |
| 1996 | 0.766 | 0.776 | 0.816 | 0.901 | 0.938 | 0.922 | 0.905 | 0.935 | 0.953 | 0.944 | 0.954 | 0.952 |
| 1997 | 0.959 | 0.931 | 0.899 | 0.885 | 0.919 | 0.910 | 0.882 | 0.930 | 0.924 | 0.879 | 0.853 | 0.803 |
| 1998 | 0.746 | 0.722 | 0.720 | 0.730 | 0.760 | 0.759 | 0.733 | 0.701 | 0.691 | 0.692 | 0.630 | 0.587 |
| 1999 | 0.596 | 0.588 | 0.666 | 0.767 | 0.764 | 0.759 | 0.796 | 0.854 | 0.900 | 0.872 | 0.892 | 0.900 |
| 2000 | 0.941 | 1.069 | 1.117 | 1.021 | 1.131 | 1.342 | 1.122 | 1.131 | 1.224 | 1.171 | 1.140 | 1.086 |
| 2001 | 1.184 | 1.172 | 1.076 | 1.236 | 1.427 | 1.193 | 1.008 | 1.227 | 1.253 | 0.881 | 0.789 | 0.714 |
| 2002 | 0.748 | 0.741 | 0.966 | 1.043 | 0.999 | 0.985 | 1.066 | 1.077 | 1.063 | 1.149 | 1.019 | 0.991 |
| 2003 | 1.067 | 1.248 | 1.230 | 1.092 | 1.089 | 1.112 | 1.146 | 1.276 | 1.189 | 1.166 | 1.109 | 1.101 |
| 2004 | 1.204 | 1.261 | 1.320 | 1.400 | 1.605 | 1.473 | 1.455 | 1.435 | 1.447 | 1.561 | 1.513 | 1.359 |
| 2005 | 1.420 | 1.494 | 1.656 | 1.693 | 1.590 | 1.696 | 1.814 | 2.120 | 2.323 | 2.053 | 1.713 | 1.754 |
| 2006 | 1.824 | 1.797 | 2.040 | 2.306 | 2.356 | 2.427 | 2.576 | 2.528 | 1.942 | 1.767 | 1.779 | 1.810 |
| - = No Data Reported; -- = Not Applicable; NA = Not Available; W = Withheld to avoid disclosure of individual company data. |
| Release Date: 6/1/2022 |
| Next Release Date: TBD |