|
Download Data (XLS File) |
|
||||||||
|
||||||||
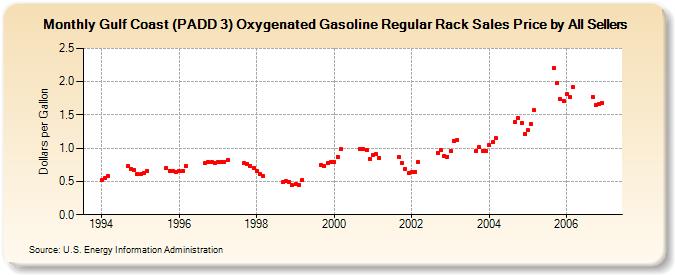
| Gulf Coast (PADD 3) Oxygenated Gasoline Regular Rack Sales Price by All Sellers (Dollars per Gallon) | ||||||||
| Year | Jan | Feb | Mar | Apr | May | Jun | Jul | Aug | Sep | Oct | Nov | Dec |
|---|---|---|---|---|---|---|---|---|---|---|---|---|
| 1994 | 0.520 | 0.559 | 0.575 | W | W | - | - | W | 0.727 | 0.693 | 0.674 | 0.615 |
| 1995 | 0.610 | 0.629 | 0.660 | NA | - | - | - | - | 0.705 | 0.663 | 0.652 | 0.640 |
| 1996 | 0.653 | 0.661 | 0.729 | - | - | - | - | - | 0.780 | 0.792 | 0.791 | 0.781 |
| 1997 | 0.789 | 0.788 | 0.793 | 0.819 | - | - | - | - | 0.775 | 0.761 | 0.738 | 0.701 |
| 1998 | 0.650 | 0.611 | 0.583 | - | - | - | - | - | 0.485 | 0.506 | 0.493 | 0.446 |
| 1999 | 0.459 | 0.454 | 0.516 | W | - | - | - | - | 0.745 | 0.732 | 0.771 | 0.785 |
| 2000 | 0.796 | 0.869 | 0.983 | W | - | - | - | - | 0.989 | 0.986 | 0.972 | 0.838 |
| 2001 | 0.897 | 0.908 | 0.859 | W | W | - | - | - | 0.866 | 0.784 | 0.689 | 0.624 |
| 2002 | 0.637 | 0.646 | 0.790 | W | - | - | - | - | 0.929 | 0.973 | 0.884 | 0.875 |
| 2003 | 0.958 | 1.111 | 1.121 | W | - | - | - | - | 0.963 | 1.012 | 0.958 | 0.954 |
| 2004 | 1.044 | 1.088 | 1.151 | - | - | W | W | - | 1.394 | 1.450 | 1.381 | 1.207 |
| 2005 | 1.268 | 1.360 | 1.570 | - | - | - | W | W | 2.205 | 1.979 | 1.739 | 1.714 |
| 2006 | 1.813 | 1.763 | 1.923 | - | - | - | - | - | 1.776 | 1.654 | 1.665 | 1.685 |
| - = No Data Reported; -- = Not Applicable; NA = Not Available; W = Withheld to avoid disclosure of individual company data. |
| Release Date: 6/1/2022 |
| Next Release Date: TBD |