|
Download Data (XLS File) |
|
||||||||
|
||||||||
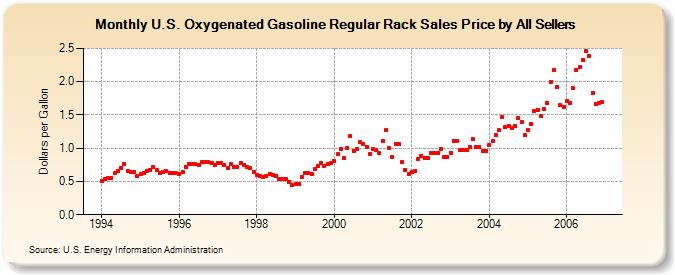
| U.S. Oxygenated Gasoline Regular Rack Sales Price by All Sellers (Dollars per Gallon) | ||||||||
| Year | Jan | Feb | Mar | Apr | May | Jun | Jul | Aug | Sep | Oct | Nov | Dec |
|---|---|---|---|---|---|---|---|---|---|---|---|---|
| 1994 | 0.513 | 0.534 | 0.545 | 0.554 | 0.622 | 0.656 | 0.707 | 0.759 | 0.655 | 0.636 | 0.636 | 0.585 |
| 1995 | 0.607 | 0.629 | 0.650 | 0.679 | 0.718 | 0.665 | 0.626 | 0.637 | 0.664 | 0.631 | 0.624 | 0.622 |
| 1996 | 0.616 | 0.645 | 0.722 | 0.761 | 0.765 | 0.767 | 0.753 | 0.785 | 0.797 | 0.785 | 0.782 | 0.754 |
| 1997 | 0.772 | 0.777 | 0.751 | 0.696 | 0.758 | 0.717 | 0.712 | 0.777 | 0.748 | 0.718 | 0.699 | 0.647 |
| 1998 | 0.592 | 0.578 | 0.561 | 0.575 | 0.607 | 0.594 | 0.587 | 0.538 | 0.541 | 0.542 | 0.498 | 0.444 |
| 1999 | 0.466 | 0.463 | 0.567 | 0.630 | 0.620 | 0.612 | 0.682 | 0.739 | 0.772 | 0.737 | 0.766 | 0.773 |
| 2000 | 0.805 | 0.906 | 0.995 | 0.852 | 0.999 | 1.183 | 0.964 | 0.992 | 1.089 | 1.069 | 1.025 | 0.912 |
| 2001 | 0.981 | 0.978 | 0.923 | 1.111 | 1.273 | 1.002 | 0.862 | 1.068 | 1.060 | 0.785 | 0.677 | 0.614 |
| 2002 | 0.639 | 0.654 | 0.830 | 0.883 | 0.854 | 0.851 | 0.929 | 0.927 | 0.930 | 0.993 | 0.868 | 0.869 |
| 2003 | 0.927 | 1.106 | 1.108 | 0.976 | 0.968 | 0.970 | 1.019 | 1.142 | 1.016 | 1.015 | 0.958 | 0.959 |
| 2004 | 1.049 | 1.107 | 1.195 | 1.266 | 1.472 | 1.318 | 1.339 | 1.304 | 1.340 | 1.461 | 1.389 | 1.197 |
| 2005 | 1.275 | 1.361 | 1.553 | 1.574 | 1.481 | 1.586 | 1.678 | 2.000 | 2.173 | 1.913 | 1.642 | 1.624 |
| 2006 | 1.707 | 1.677 | 1.902 | 2.179 | 2.217 | 2.318 | 2.465 | 2.384 | 1.830 | 1.670 | 1.676 | 1.697 |
| - = No Data Reported; -- = Not Applicable; NA = Not Available; W = Withheld to avoid disclosure of individual company data. |
| Release Date: 6/1/2022 |
| Next Release Date: TBD |