|
Download Data (XLS File) |
|
||||||||
|
||||||||
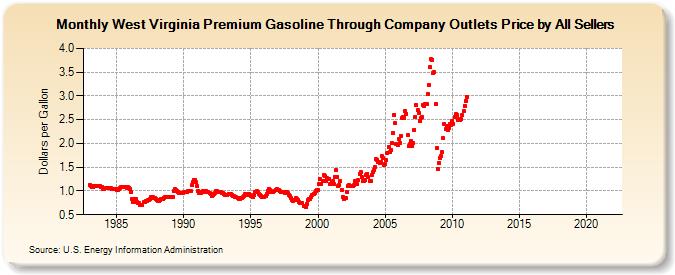
| West Virginia Premium Gasoline Through Company Outlets Price by All Sellers (Dollars per Gallon) | ||||||||
| Year | Jan | Feb | Mar | Apr | May | Jun | Jul | Aug | Sep | Oct | Nov | Dec |
|---|---|---|---|---|---|---|---|---|---|---|---|---|
| 1983 | 1.130 | 1.104 | 1.084 | 1.083 | 1.100 | 1.112 | 1.106 | 1.103 | 1.100 | 1.097 | 1.092 | 1.088 |
| 1984 | 1.034 | 1.039 | 1.065 | 1.054 | 1.065 | 1.059 | 1.056 | 1.053 | 1.050 | 1.048 | 1.040 | 1.036 |
| 1985 | 1.027 | 1.019 | 1.034 | 1.057 | 1.073 | 1.081 | 1.089 | 1.085 | 1.075 | 1.070 | 1.077 | 1.068 |
| 1986 | 1.051 | 0.978 | 0.829 | 0.775 | 0.823 | 0.824 | 0.767 | 0.749 | 0.741 | 0.708 | 0.713 | 0.714 |
| 1987 | 0.762 | 0.770 | 0.782 | 0.786 | 0.813 | 0.816 | 0.840 | 0.865 | 0.863 | 0.855 | 0.852 | 0.840 |
| 1988 | 0.814 | 0.799 | 0.796 | 0.810 | 0.826 | 0.832 | 0.856 | 0.866 | 0.870 | 0.865 | 0.870 | 0.864 |
| 1989 | 0.876 | 0.875 | 0.881 | 0.998 | 1.034 | 1.018 | 1.007 | 0.985 | 0.964 | 0.963 | 0.956 | 0.955 |
| 1990 | 0.975 | 0.975 | 0.972 | 0.973 | 0.999 | 1.007 | 1.007 | 1.119 | 1.188 | 1.236 | 1.240 | 1.179 |
| 1991 | 1.102 | 1.003 | 0.958 | 0.953 | 0.987 | 1.000 | 0.985 | 0.989 | 0.994 | 0.987 | 0.987 | 0.964 |
| 1992 | 0.933 | 0.901 | 0.910 | 0.930 | 0.959 | 0.992 | 0.989 | 0.979 | 0.981 | 0.969 | 0.960 | 0.950 |
| 1993 | 0.941 | 0.917 | 0.906 | 0.917 | 0.946 | 0.938 | 0.934 | 0.916 | 0.903 | 0.903 | 0.880 | 0.867 |
| 1994 | 0.856 | 0.841 | 0.838 | 0.844 | 0.859 | 0.865 | 0.894 | 0.937 | 0.932 | 0.908 | 0.936 | 0.915 |
| 1995 | 0.904 | 0.890 | 0.875 | 0.908 | 0.987 | 0.998 | 0.978 | 0.946 | 0.925 | 0.901 | 0.877 | 0.875 |
| 1996 | 0.880 | 0.894 | 0.928 | 1.006 | 1.048 | 1.021 | 0.987 | 0.982 | 0.983 | 0.991 | 1.027 | 1.035 |
| 1997 | 1.030 | 1.022 | 0.990 | 0.980 | 0.981 | 0.972 | 0.958 | 0.986 | 0.984 | 0.955 | 0.924 | 0.884 |
| 1998 | 0.848 | 0.818 | 0.799 | 0.819 | 0.846 | 0.841 | 0.815 | 0.770 | 0.749 | 0.756 | 0.745 | 0.690 |
| 1999 | 0.680 | 0.659 | 0.729 | 0.816 | 0.838 | 0.832 | 0.877 | 0.920 | 0.944 | 0.951 | 1.000 | 1.021 |
| 2000 | 1.030 | 1.137 | 1.243 | 1.146 | 1.200 | 1.328 | 1.316 | 1.208 | 1.265 | 1.258 | 1.253 | 1.144 |
| 2001 | 1.179 | 1.199 | 1.137 | 1.302 | 1.434 | 1.301 | 1.102 | 1.119 | 1.201 | 1.022 | 0.882 | 0.824 |
| 2002 | 0.853 | 0.842 | 0.972 | 1.113 | 1.115 | 1.097 | 1.100 | 1.102 | 1.124 | 1.204 | 1.160 | 1.136 |
| 2003 | 1.222 | 1.358 | 1.390 | 1.288 | 1.206 | 1.199 | 1.233 | 1.336 | 1.367 | 1.284 | 1.214 | 1.205 |
| 2004 | 1.332 | 1.394 | 1.442 | 1.504 | 1.668 | 1.651 | 1.604 | 1.593 | 1.604 | 1.733 | 1.683 | 1.544 |
| 2005 | 1.567 | 1.642 | 1.798 | 1.922 | 1.819 | 1.868 | 1.999 | 2.218 | 2.607 | 2.427 | 1.980 | 1.962 |
| 2006 | 2.103 | 2.015 | 2.163 | 2.532 | 2.561 | 2.540 | 2.675 | 2.626 | 2.171 | 1.940 | 1.979 | 2.051 |
| 2007 | 1.944 | 1.999 | 2.290 | 2.557 | 2.807 | 2.694 | 2.644 | 2.480 | 2.542 | 2.549 | 2.811 | 2.783 |
| 2008 | 2.828 | 2.821 | 3.030 | 3.227 | 3.605 | 3.771 | 3.762 | 3.489 | 3.493 | 2.832 | 1.899 | 1.472 |
| 2009 | 1.596 | 1.685 | 1.732 | 1.812 | 2.107 | 2.399 | 2.299 | 2.374 | 2.286 | 2.322 | 2.412 | 2.378 |
| 2010 | 2.472 | 2.419 | 2.564 | 2.614 | 2.599 | 2.499 | 2.524 | 2.486 | 2.507 | 2.589 | 2.677 | 2.793 |
| 2011 | 2.900 | 2.985 | - | - | - | - | - | - | - | - | - | - |
| 2012 | - | - | - | - | - | - | - | - | - | - | - | - |
| 2013 | - | - | - | - | - | - | - | - | - | - | - | - |
| 2014 | - | - | - | - | - | - | - | - | - | - | - | - |
| 2015 | - | - | - | - | - | - | - | - | - | - | - | - |
| 2016 | - | - | - | - | - | - | - | - | - | - | - | - |
| 2017 | - | - | - | - | - | - | - | - | - | - | - | - |
| 2018 | - | - | - | - | - | - | - | - | - | - | - | - |
| 2019 | - | - | - | - | - | - | - | - | - | - | - | - |
| 2020 | - | - | - | - | - | - | - | - | - | - | - | - |
| 2021 | - | - | - | - | - | - | - | - | - | - | - | - |
| 2022 | - | - | - | |||||||||
| - = No Data Reported; -- = Not Applicable; NA = Not Available; W = Withheld to avoid disclosure of individual company data. |
| Release Date: 6/1/2022 |
| Next Release Date: TBD |