|
Download Data (XLS File) |
|
||||||||
|
||||||||
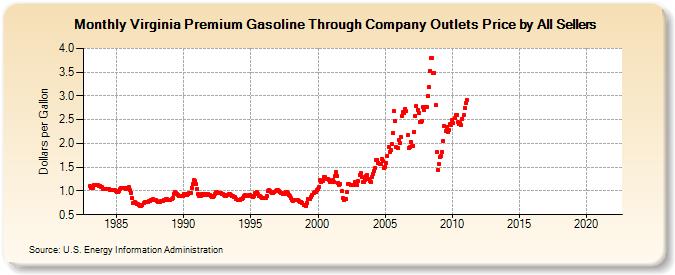
| Virginia Premium Gasoline Through Company Outlets Price by All Sellers (Dollars per Gallon) | ||||||||
| Year | Jan | Feb | Mar | Apr | May | Jun | Jul | Aug | Sep | Oct | Nov | Dec |
|---|---|---|---|---|---|---|---|---|---|---|---|---|
| 1983 | 1.097 | 1.071 | 1.089 | 1.071 | 1.117 | 1.127 | 1.125 | 1.117 | 1.112 | 1.106 | 1.091 | 1.073 |
| 1984 | 1.038 | 1.043 | 1.047 | 1.049 | 1.051 | 1.044 | 1.030 | 1.021 | 1.022 | 1.024 | 1.012 | 1.000 |
| 1985 | 0.983 | 0.970 | 0.993 | 1.041 | 1.060 | 1.072 | 1.072 | 1.063 | 1.048 | 1.069 | 1.071 | 1.077 |
| 1986 | 1.018 | 0.963 | 0.843 | 0.757 | 0.770 | 0.747 | 0.732 | 0.715 | 0.711 | 0.691 | 0.692 | 0.697 |
| 1987 | 0.738 | 0.761 | 0.773 | 0.772 | 0.760 | 0.782 | 0.789 | 0.815 | 0.822 | 0.816 | 0.811 | 0.800 |
| 1988 | 0.785 | 0.769 | 0.769 | 0.777 | 0.798 | 0.789 | 0.807 | 0.816 | 0.827 | 0.822 | 0.817 | 0.817 |
| 1989 | 0.819 | 0.824 | 0.847 | 0.941 | 0.974 | 0.948 | 0.939 | 0.924 | 0.903 | 0.901 | 0.897 | 0.901 |
| 1990 | 0.946 | 0.930 | 0.916 | 0.923 | 0.931 | 0.950 | 0.948 | 1.068 | 1.143 | 1.229 | 1.218 | 1.144 |
| 1991 | 1.046 | 0.941 | 0.889 | 0.896 | 0.936 | 0.933 | 0.912 | 0.930 | 0.941 | 0.918 | 0.935 | 0.916 |
| 1992 | 0.889 | 0.876 | 0.872 | 0.901 | 0.936 | 0.970 | 0.968 | 0.962 | 0.955 | 0.948 | 0.942 | 0.932 |
| 1993 | 0.916 | 0.900 | 0.895 | 0.916 | 0.926 | 0.929 | 0.914 | 0.904 | 0.888 | 0.881 | 0.868 | 0.836 |
| 1994 | 0.817 | 0.815 | 0.814 | 0.821 | 0.829 | 0.854 | 0.893 | 0.912 | 0.904 | 0.896 | 0.914 | 0.913 |
| 1995 | 0.895 | 0.887 | 0.874 | 0.900 | 0.965 | 0.969 | 0.930 | 0.901 | 0.889 | 0.866 | 0.843 | 0.849 |
| 1996 | 0.858 | 0.858 | 0.899 | 0.993 | 1.025 | 1.001 | 0.987 | 0.962 | 0.965 | 0.975 | 1.002 | 1.016 |
| 1997 | 1.013 | 0.997 | 0.982 | 0.956 | 0.953 | 0.941 | 0.934 | 0.977 | 0.972 | 0.954 | 0.925 | 0.899 |
| 1998 | 0.850 | 0.817 | 0.794 | 0.804 | 0.813 | 0.808 | 0.800 | 0.785 | 0.765 | 0.777 | 0.754 | 0.704 |
| 1999 | 0.702 | 0.681 | 0.736 | 0.825 | 0.837 | 0.834 | 0.878 | 0.925 | 0.966 | 0.974 | 0.985 | 1.022 |
| 2000 | 1.036 | 1.085 | 1.229 | 1.186 | 1.219 | 1.290 | 1.304 | 1.243 | 1.259 | 1.249 | 1.239 | 1.182 |
| 2001 | 1.219 | 1.232 | 1.184 | 1.317 | 1.395 | 1.322 | 1.173 | 1.132 | 1.149 | 0.990 | 0.855 | 0.807 |
| 2002 | 0.836 | 0.830 | 0.968 | 1.155 | 1.146 | 1.123 | 1.123 | 1.121 | 1.124 | 1.179 | 1.149 | 1.130 |
| 2003 | 1.204 | 1.331 | 1.372 | 1.290 | 1.196 | 1.188 | 1.224 | 1.313 | 1.335 | 1.256 | 1.205 | 1.185 |
| 2004 | 1.300 | 1.357 | 1.424 | 1.478 | 1.651 | 1.661 | 1.598 | 1.577 | 1.568 | 1.678 | 1.631 | 1.486 |
| 2005 | 1.512 | 1.584 | 1.733 | 1.928 | 1.828 | 1.853 | 1.995 | 2.223 | 2.682 | 2.463 | 1.923 | 1.903 |
| 2006 | 2.067 | 2.004 | 2.143 | 2.579 | 2.670 | 2.648 | 2.732 | 2.672 | 2.172 | 1.897 | 1.921 | 2.034 |
| 2007 | 1.940 | 1.956 | 2.250 | 2.579 | 2.782 | 2.714 | 2.648 | 2.453 | 2.459 | 2.477 | 2.764 | 2.702 |
| 2008 | 2.757 | 2.763 | 3.003 | 3.179 | 3.531 | 3.789 | 3.801 | 3.473 | 3.485 | 2.801 | 1.817 | 1.448 |
| 2009 | 1.562 | 1.706 | 1.737 | 1.825 | 2.060 | 2.366 | 2.262 | 2.353 | 2.241 | 2.275 | 2.404 | 2.380 |
| 2010 | 2.490 | 2.425 | 2.535 | 2.608 | 2.593 | 2.443 | 2.412 | 2.434 | 2.387 | 2.522 | 2.591 | 2.746 |
| 2011 | 2.847 | 2.914 | - | - | - | - | - | - | - | - | - | - |
| 2012 | - | - | - | - | - | - | - | - | - | - | - | - |
| 2013 | - | - | - | - | - | - | - | - | - | - | - | - |
| 2014 | - | - | - | - | - | - | - | - | - | - | - | - |
| 2015 | - | - | - | - | - | - | - | - | - | - | - | - |
| 2016 | - | - | - | - | - | - | - | - | - | - | - | - |
| 2017 | - | - | - | - | - | - | - | - | - | - | - | - |
| 2018 | - | - | - | - | - | - | - | - | - | - | - | - |
| 2019 | - | - | - | - | - | - | - | - | - | - | - | - |
| 2020 | - | - | - | - | - | - | - | - | - | - | - | - |
| 2021 | - | - | - | - | - | - | - | - | - | - | - | - |
| 2022 | - | - | - | |||||||||
| - = No Data Reported; -- = Not Applicable; NA = Not Available; W = Withheld to avoid disclosure of individual company data. |
| Release Date: 6/1/2022 |
| Next Release Date: TBD |