|
Download Data (XLS File) |
|
||||||||
|
||||||||
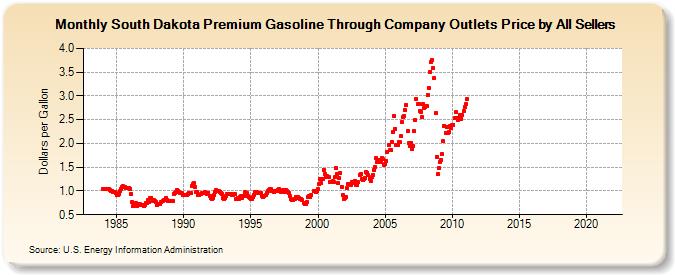
| South Dakota Premium Gasoline Through Company Outlets Price by All Sellers (Dollars per Gallon) | ||||||||
| Year | Jan | Feb | Mar | Apr | May | Jun | Jul | Aug | Sep | Oct | Nov | Dec |
|---|---|---|---|---|---|---|---|---|---|---|---|---|
| 1983 | W | W | W | W | W | W | W | W | W | W | W | W |
| 1984 | 1.041 | 1.040 | 1.033 | 1.047 | 1.048 | 1.036 | 1.029 | 1.005 | 0.997 | 0.983 | 0.973 | 0.957 |
| 1985 | 0.905 | 0.908 | 0.932 | 0.992 | 1.032 | 1.089 | 1.094 | 1.081 | 1.069 | 1.065 | 1.065 | 1.066 |
| 1986 | 1.044 | 0.945 | 0.772 | 0.677 | 0.711 | 0.749 | 0.681 | 0.720 | 0.712 | 0.721 | 0.710 | 0.700 |
| 1987 | 0.682 | 0.707 | 0.744 | 0.755 | 0.800 | 0.761 | 0.842 | 0.862 | 0.796 | 0.804 | 0.785 | 0.773 |
| 1988 | 0.713 | 0.725 | 0.716 | 0.725 | 0.772 | 0.791 | 0.805 | 0.813 | 0.862 | 0.820 | 0.785 | 0.798 |
| 1989 | 0.796 | 0.791 | 0.799 | 0.937 | 0.966 | 0.988 | 1.026 | 0.993 | 0.969 | 0.957 | 0.956 | 0.905 |
| 1990 | 0.916 | 0.910 | 0.905 | 0.912 | 0.946 | 0.962 | 0.959 | 1.110 | 1.152 | 1.169 | 1.079 | 0.977 |
| 1991 | 0.983 | 0.923 | 0.907 | 0.929 | 0.949 | 0.952 | 0.947 | 0.977 | 0.956 | 0.939 | 0.960 | 0.901 |
| 1992 | 0.843 | 0.834 | 0.862 | 0.908 | 0.971 | 1.012 | 1.009 | 0.999 | 0.984 | 0.966 | 0.938 | 0.855 |
| 1993 | 0.841 | 0.862 | 0.898 | 0.929 | 0.944 | 0.941 | 0.933 | 0.916 | 0.913 | 0.934 | 0.928 | 0.822 |
| 1994 | 0.846 | 0.834 | 0.867 | 0.889 | 0.853 | 0.892 | 0.894 | 0.974 | 0.954 | 0.886 | 0.865 | 0.842 |
| 1995 | 0.835 | 0.833 | 0.872 | 0.910 | 0.974 | 0.977 | 0.957 | 0.962 | 0.948 | 0.953 | 0.899 | 0.872 |
| 1996 | 0.887 | 0.905 | 0.958 | 0.996 | 1.025 | 1.042 | 1.032 | 1.009 | 1.002 | 0.985 | 1.002 | 1.008 |
| 1997 | 1.030 | 1.034 | 0.997 | 0.986 | 0.999 | 1.011 | 0.968 | 1.018 | 1.001 | 0.977 | 0.961 | 0.890 |
| 1998 | 0.826 | 0.812 | 0.809 | 0.832 | 0.866 | 0.858 | 0.866 | 0.857 | 0.834 | 0.836 | 0.805 | 0.750 |
| 1999 | 0.716 | 0.718 | 0.772 | 0.872 | 0.886 | 0.878 | 0.915 | NA | 0.995 | 0.999 | 0.978 | 1.000 |
| 2000 | 1.036 | 1.150 | 1.251 | 1.169 | 1.242 | 1.447 | 1.353 | 1.286 | 1.325 | 1.304 | 1.286 | 1.178 |
| 2001 | 1.179 | 1.212 | 1.184 | 1.285 | 1.486 | 1.366 | 1.163 | 1.276 | 1.379 | 1.093 | 0.913 | 0.840 |
| 2002 | 0.850 | 0.868 | 1.056 | 1.138 | 1.139 | 1.119 | 1.178 | NA | 1.166 | 1.216 | 1.131 | 1.123 |
| 2003 | 1.178 | 1.337 | 1.353 | 1.245 | 1.229 | 1.252 | 1.282 | 1.406 | 1.388 | 1.326 | 1.261 | 1.214 |
| 2004 | 1.287 | 1.337 | 1.449 | 1.505 | 1.685 | 1.601 | 1.627 | 1.657 | 1.599 | 1.694 | 1.666 | 1.556 |
| 2005 | 1.558 | 1.640 | 1.813 | 1.964 | 1.856 | 1.869 | 2.021 | 2.250 | 2.583 | 2.313 | 1.976 | 1.965 |
| 2006 | 2.035 | 2.024 | 2.150 | 2.452 | 2.561 | 2.581 | 2.698 | 2.812 | 2.266 | 2.005 | 1.944 | 2.018 |
| 2007 | 1.878 | 1.940 | 2.252 | 2.495 | 2.934 | 2.821 | 2.823 | 2.687 | 2.669 | 2.548 | 2.827 | 2.748 |
| 2008 | 2.771 | 2.790 | 3.022 | 3.175 | 3.505 | 3.713 | 3.755 | 3.578 | 3.379 | 2.637 | 1.721 | 1.351 |
| 2009 | 1.479 | 1.614 | 1.658 | 1.770 | 2.045 | 2.374 | 2.225 | 2.339 | 2.226 | 2.250 | 2.371 | 2.315 |
| 2010 | 2.394 | 2.388 | 2.534 | 2.651 | 2.542 | 2.490 | 2.541 | 2.594 | 2.522 | 2.593 | 2.674 | 2.761 |
| 2011 | 2.829 | 2.926 | - | - | - | - | - | - | - | - | - | - |
| 2012 | - | - | - | - | - | - | - | - | - | - | - | - |
| 2013 | - | - | - | - | - | - | - | - | - | - | - | - |
| 2014 | - | - | - | - | - | - | - | - | - | - | - | - |
| 2015 | - | - | - | - | - | - | - | - | - | - | - | - |
| 2016 | - | - | - | - | - | - | - | - | - | - | - | - |
| 2017 | - | - | - | - | - | - | - | - | - | - | - | - |
| 2018 | - | - | - | - | - | - | - | - | - | - | - | - |
| 2019 | - | - | - | - | - | - | - | - | - | - | - | - |
| 2020 | - | - | - | - | - | - | - | - | - | - | - | - |
| 2021 | - | - | - | - | - | - | - | - | - | - | - | - |
| 2022 | - | - | - | |||||||||
| - = No Data Reported; -- = Not Applicable; NA = Not Available; W = Withheld to avoid disclosure of individual company data. |
| Release Date: 6/1/2022 |
| Next Release Date: TBD |