|
Download Data (XLS File) |
|
||||||||
|
||||||||
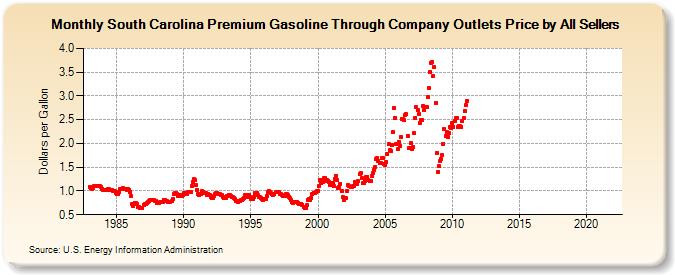
| South Carolina Premium Gasoline Through Company Outlets Price by All Sellers (Dollars per Gallon) | ||||||||
| Year | Jan | Feb | Mar | Apr | May | Jun | Jul | Aug | Sep | Oct | Nov | Dec |
|---|---|---|---|---|---|---|---|---|---|---|---|---|
| 1983 | 1.091 | 1.071 | 1.048 | 1.065 | 1.104 | 1.111 | 1.101 | 1.106 | 1.113 | 1.098 | 1.087 | 1.047 |
| 1984 | 1.019 | 1.024 | 1.030 | 1.030 | 1.038 | 1.032 | 1.013 | 1.010 | 1.017 | 1.006 | 0.998 | 0.963 |
| 1985 | 0.931 | 0.938 | 0.971 | 1.033 | 1.043 | 1.050 | 1.052 | 1.041 | 1.034 | 1.028 | 1.034 | 1.028 |
| 1986 | 0.974 | 0.884 | 0.718 | 0.686 | 0.751 | 0.741 | 0.717 | 0.671 | 0.671 | 0.645 | 0.649 | 0.651 |
| 1987 | 0.707 | 0.719 | 0.730 | 0.742 | 0.762 | 0.779 | 0.811 | 0.816 | 0.805 | 0.806 | 0.797 | 0.784 |
| 1988 | 0.757 | 0.747 | 0.750 | 0.769 | 0.776 | 0.777 | 0.816 | 0.817 | 0.786 | 0.781 | 0.777 | 0.778 |
| 1989 | 0.776 | 0.788 | 0.824 | 0.932 | 0.954 | 0.949 | 0.928 | 0.898 | 0.902 | 0.909 | 0.900 | 0.906 |
| 1990 | 0.956 | 0.948 | 0.941 | 0.942 | 0.973 | 0.979 | 0.977 | 1.105 | 1.192 | 1.243 | 1.230 | 1.116 |
| 1991 | 1.029 | 0.941 | 0.910 | 0.938 | 0.990 | 0.973 | 0.954 | 0.965 | 0.949 | 0.922 | 0.933 | 0.910 |
| 1992 | 0.872 | 0.850 | 0.847 | 0.888 | 0.940 | 0.963 | 0.952 | 0.940 | 0.932 | 0.920 | 0.907 | 0.878 |
| 1993 | 0.853 | 0.848 | 0.854 | 0.891 | 0.910 | 0.905 | 0.893 | 0.881 | 0.865 | 0.855 | 0.827 | 0.783 |
| 1994 | 0.759 | 0.783 | 0.783 | 0.812 | 0.818 | 0.829 | 0.858 | 0.913 | 0.905 | 0.873 | 0.907 | 0.871 |
| 1995 | 0.840 | 0.836 | 0.822 | 0.881 | 0.957 | 0.952 | 0.913 | 0.879 | 0.869 | 0.847 | 0.824 | 0.813 |
| 1996 | 0.837 | 0.831 | 0.894 | 0.983 | 0.999 | 0.975 | 0.949 | 0.938 | 0.924 | 0.933 | 0.971 | 0.982 |
| 1997 | 0.982 | 0.969 | 0.944 | 0.927 | 0.917 | 0.894 | 0.885 | 0.933 | 0.941 | 0.908 | 0.878 | 0.842 |
| 1998 | 0.804 | 0.769 | 0.752 | 0.772 | 0.778 | 0.766 | 0.751 | 0.730 | 0.719 | 0.735 | 0.711 | 0.669 |
| 1999 | 0.645 | 0.635 | 0.703 | 0.818 | 0.828 | 0.816 | 0.862 | 0.929 | 0.965 | 0.961 | 0.974 | 0.997 |
| 2000 | 1.008 | 1.101 | 1.236 | 1.164 | 1.183 | 1.266 | 1.270 | 1.201 | 1.236 | 1.216 | 1.192 | 1.120 |
| 2001 | 1.160 | 1.177 | 1.108 | 1.255 | 1.321 | 1.222 | 1.069 | 1.078 | 1.147 | 1.008 | 0.871 | 0.816 |
| 2002 | 0.854 | 0.842 | 0.997 | 1.123 | 1.106 | 1.083 | 1.092 | 1.096 | 1.114 | 1.194 | 1.171 | 1.152 |
| 2003 | 1.204 | 1.350 | 1.380 | 1.271 | 1.160 | 1.171 | 1.212 | 1.300 | 1.304 | 1.234 | 1.204 | 1.208 |
| 2004 | 1.313 | 1.370 | 1.436 | 1.501 | 1.673 | 1.685 | 1.638 | 1.593 | 1.584 | 1.699 | 1.690 | 1.562 |
| 2005 | 1.551 | 1.612 | 1.781 | 1.979 | 1.853 | 1.845 | 1.965 | 2.239 | 2.747 | 2.538 | 1.985 | 1.877 |
| 2006 | 2.033 | 1.956 | 2.136 | 2.513 | 2.512 | 2.486 | 2.600 | 2.612 | 2.162 | 1.903 | 1.912 | 2.002 |
| 2007 | 1.879 | 1.916 | 2.211 | 2.544 | 2.761 | 2.699 | 2.619 | 2.434 | 2.485 | 2.503 | 2.786 | 2.701 |
| 2008 | 2.757 | 2.763 | 2.973 | 3.166 | 3.509 | 3.703 | 3.720 | 3.418 | 3.601 | 2.859 | 1.802 | 1.409 |
| 2009 | 1.515 | 1.628 | 1.670 | 1.758 | 1.997 | 2.304 | 2.159 | 2.247 | 2.143 | 2.210 | 2.349 | 2.320 |
| 2010 | 2.440 | 2.356 | 2.476 | 2.526 | 2.541 | 2.352 | 2.360 | 2.357 | 2.341 | 2.473 | 2.531 | 2.692 |
| 2011 | 2.802 | 2.894 | - | - | - | - | - | - | - | - | - | - |
| 2012 | - | - | - | - | - | - | - | - | - | - | - | - |
| 2013 | - | - | - | - | - | - | - | - | - | - | - | - |
| 2014 | - | - | - | - | - | - | - | - | - | - | - | - |
| 2015 | - | - | - | - | - | - | - | - | - | - | - | - |
| 2016 | - | - | - | - | - | - | - | - | - | - | - | - |
| 2017 | - | - | - | - | - | - | - | - | - | - | - | - |
| 2018 | - | - | - | - | - | - | - | - | - | - | - | - |
| 2019 | - | - | - | - | - | - | - | - | - | - | - | - |
| 2020 | - | - | - | - | - | - | - | - | - | - | - | - |
| 2021 | - | - | - | - | - | - | - | - | - | - | - | - |
| 2022 | - | - | - | |||||||||
| - = No Data Reported; -- = Not Applicable; NA = Not Available; W = Withheld to avoid disclosure of individual company data. |
| Release Date: 6/1/2022 |
| Next Release Date: TBD |