|
Download Data (XLS File) |
|
||||||||
|
||||||||
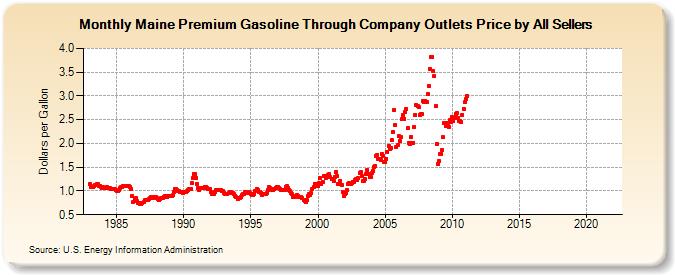
| Maine Premium Gasoline Through Company Outlets Price by All Sellers (Dollars per Gallon) | ||||||||
| Year | Jan | Feb | Mar | Apr | May | Jun | Jul | Aug | Sep | Oct | Nov | Dec |
|---|---|---|---|---|---|---|---|---|---|---|---|---|
| 1983 | 1.151 | 1.084 | 1.086 | 1.090 | 1.098 | 1.122 | 1.138 | 1.140 | 1.112 | 1.109 | 1.081 | 1.063 |
| 1984 | 1.073 | 1.071 | 1.072 | 1.076 | 1.063 | 1.054 | 1.052 | 1.040 | 1.039 | 1.038 | 1.035 | 1.027 |
| 1985 | 1.009 | 1.007 | 1.018 | 1.062 | 1.089 | 1.092 | 1.100 | 1.108 | 1.102 | 1.099 | 1.102 | 1.097 |
| 1986 | 1.079 | 1.039 | 0.897 | 0.776 | 0.835 | 0.847 | 0.786 | 0.757 | 0.751 | 0.734 | 0.726 | 0.746 |
| 1987 | 0.762 | 0.802 | 0.808 | 0.814 | 0.818 | 0.836 | 0.855 | 0.870 | 0.861 | 0.866 | 0.875 | 0.864 |
| 1988 | 0.847 | 0.830 | 0.807 | 0.827 | 0.847 | 0.845 | 0.880 | 0.886 | 0.896 | 0.881 | 0.896 | 0.895 |
| 1989 | 0.898 | 0.896 | 0.914 | 0.985 | 1.040 | 1.044 | 1.016 | 0.998 | 0.991 | 0.979 | 0.980 | 0.966 |
| 1990 | 0.983 | 0.988 | 0.983 | 0.991 | 1.018 | 1.039 | 1.047 | 1.164 | 1.272 | 1.363 | 1.348 | 1.277 |
| 1991 | 1.155 | 1.056 | 1.022 | 1.055 | 1.070 | 1.068 | 1.068 | 1.090 | 1.089 | 1.067 | 1.045 | 1.031 |
| 1992 | 0.973 | 0.944 | 0.932 | 0.944 | 0.974 | 1.010 | 1.017 | 1.011 | 1.017 | 1.012 | 1.005 | 0.991 |
| 1993 | 0.963 | 0.943 | 0.936 | 0.937 | 0.960 | 0.978 | 0.971 | 0.965 | 0.957 | 0.928 | 0.895 | 0.863 |
| 1994 | 0.835 | 0.851 | 0.855 | 0.874 | 0.913 | 0.932 | 0.940 | 0.976 | 0.970 | 0.947 | 0.979 | 0.951 |
| 1995 | 0.927 | 0.919 | 0.919 | 0.940 | 1.006 | 1.045 | 1.011 | 0.979 | 0.980 | 0.966 | 0.924 | 0.938 |
| 1996 | 0.943 | 0.934 | 0.953 | 1.020 | 1.073 | 1.060 | 1.032 | 1.022 | 1.025 | 1.040 | 1.059 | 1.087 |
| 1997 | 1.085 | 1.065 | 1.047 | 1.021 | 1.025 | 1.029 | 1.014 | 1.082 | 1.097 | 1.062 | 1.029 | 0.996 |
| 1998 | 0.966 | 0.927 | 0.877 | 0.879 | 0.901 | 0.911 | 0.902 | 0.879 | 0.868 | 0.875 | 0.850 | 0.812 |
| 1999 | 0.792 | 0.760 | 0.800 | 0.897 | 0.929 | 0.912 | 0.955 | 1.035 | 1.080 | 1.150 | 1.141 | 1.124 |
| 2000 | 1.103 | 1.172 | 1.273 | 1.137 | 1.185 | 1.314 | 1.312 | 1.269 | 1.316 | 1.330 | 1.351 | 1.288 |
| 2001 | 1.252 | 1.249 | 1.212 | 1.289 | 1.403 | 1.320 | 1.144 | 1.141 | 1.213 | 1.124 | 0.983 | 0.894 |
| 2002 | 0.943 | 0.961 | 1.021 | 1.148 | 1.158 | 1.141 | 1.160 | 1.196 | 1.185 | 1.223 | 1.246 | 1.234 |
| 2003 | 1.265 | 1.376 | 1.402 | 1.311 | 1.207 | 1.210 | 1.254 | 1.361 | 1.446 | 1.358 | 1.300 | 1.296 |
| 2004 | 1.379 | 1.428 | 1.496 | 1.529 | 1.736 | 1.762 | 1.674 | 1.665 | 1.643 | 1.780 | 1.740 | 1.599 |
| 2005 | 1.606 | 1.682 | 1.810 | 1.955 | 1.884 | 1.907 | 2.066 | 2.239 | 2.704 | 2.386 | 1.931 | 1.958 |
| 2006 | 2.147 | 2.041 | 2.134 | 2.509 | 2.595 | 2.517 | 2.651 | 2.725 | 2.320 | 2.016 | 1.995 | 2.136 |
| 2007 | 2.009 | 2.018 | 2.345 | 2.600 | 2.809 | 2.784 | 2.763 | 2.605 | 2.628 | 2.617 | 2.894 | 2.868 |
| 2008 | 2.900 | 2.874 | 3.039 | 3.202 | 3.567 | 3.827 | 3.820 | 3.521 | 3.415 | 2.778 | 1.992 | 1.563 |
| 2009 | 1.626 | 1.774 | 1.785 | 1.860 | 2.125 | 2.438 | 2.361 | 2.440 | 2.404 | 2.349 | 2.487 | 2.454 |
| 2010 | 2.548 | 2.466 | 2.544 | 2.629 | 2.641 | 2.531 | 2.472 | 2.472 | 2.451 | 2.601 | 2.732 | 2.862 |
| 2011 | 2.934 | 2.998 | - | - | - | - | - | - | - | - | - | - |
| 2012 | - | - | - | - | - | - | - | - | - | - | - | - |
| 2013 | - | - | - | - | - | - | - | - | - | - | - | - |
| 2014 | - | - | - | - | - | - | - | - | - | - | - | - |
| 2015 | - | - | - | - | - | - | - | - | - | - | - | - |
| 2016 | - | - | - | - | - | - | - | - | - | - | - | - |
| 2017 | - | - | - | - | - | - | - | - | - | - | - | - |
| 2018 | - | - | - | - | - | - | - | - | - | - | - | - |
| 2019 | - | - | - | - | - | - | - | - | - | - | - | - |
| 2020 | - | - | - | - | - | - | - | - | - | - | - | - |
| 2021 | - | - | - | - | - | - | - | - | - | - | - | - |
| 2022 | - | - | - | |||||||||
| - = No Data Reported; -- = Not Applicable; NA = Not Available; W = Withheld to avoid disclosure of individual company data. |
| Release Date: 6/1/2022 |
| Next Release Date: TBD |