|
Download Data (XLS File) |
|
||||||||
|
||||||||
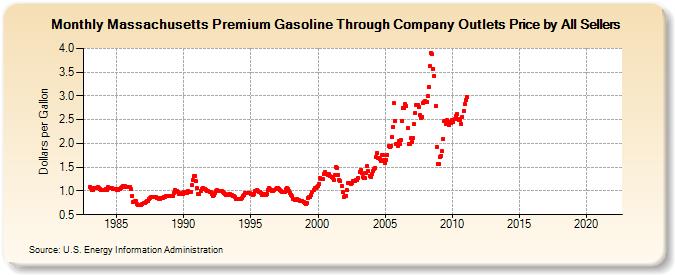
| Massachusetts Premium Gasoline Through Company Outlets Price by All Sellers (Dollars per Gallon) | ||||||||
| Year | Jan | Feb | Mar | Apr | May | Jun | Jul | Aug | Sep | Oct | Nov | Dec |
|---|---|---|---|---|---|---|---|---|---|---|---|---|
| 1983 | 1.089 | 1.052 | 1.015 | 1.016 | 1.054 | 1.068 | 1.072 | 1.074 | 1.063 | 1.047 | 1.025 | NA |
| 1984 | 1.010 | 1.012 | 1.042 | 1.023 | 1.076 | 1.072 | 1.063 | 1.053 | 1.052 | 1.044 | 1.042 | 1.037 |
| 1985 | 1.013 | 1.023 | 1.036 | 1.046 | 1.068 | 1.087 | 1.099 | 1.094 | 1.085 | 1.080 | 1.089 | 1.090 |
| 1986 | 1.075 | 1.032 | 0.904 | 0.768 | 0.779 | 0.791 | 0.724 | 0.694 | 0.700 | 0.706 | 0.714 | 0.720 |
| 1987 | 0.744 | 0.752 | 0.766 | 0.785 | 0.799 | 0.828 | 0.843 | 0.871 | 0.872 | 0.867 | 0.870 | 0.870 |
| 1988 | 0.862 | 0.854 | 0.841 | 0.841 | 0.850 | 0.861 | 0.879 | 0.880 | 0.892 | 0.891 | 0.896 | 0.898 |
| 1989 | 0.895 | 0.894 | 0.898 | 0.962 | 1.012 | 1.009 | 1.003 | 0.975 | 0.944 | 0.939 | 0.947 | 0.945 |
| 1990 | 0.981 | 0.976 | 0.966 | 0.962 | 0.989 | 0.982 | 0.987 | 1.119 | 1.222 | 1.309 | 1.312 | 1.209 |
| 1991 | 1.052 | 0.945 | 0.944 | 1.003 | 1.049 | 1.059 | 1.041 | 1.042 | 1.028 | 1.006 | 1.003 | 0.984 |
| 1992 | 0.971 | 0.936 | 0.904 | 0.909 | 0.958 | 1.008 | 1.019 | 1.009 | 1.002 | 0.996 | 0.989 | 0.969 |
| 1993 | 0.959 | 0.941 | 0.925 | 0.910 | 0.926 | 0.934 | 0.925 | 0.913 | 0.896 | 0.888 | 0.868 | 0.840 |
| 1994 | 0.828 | 0.833 | 0.832 | 0.840 | 0.860 | 0.884 | 0.912 | 0.963 | 0.962 | 0.954 | 0.956 | 0.948 |
| 1995 | 0.946 | 0.941 | 0.922 | 0.936 | 0.991 | 1.011 | 1.000 | 0.984 | 0.973 | 0.955 | 0.918 | 0.925 |
| 1996 | 0.935 | 0.923 | 0.937 | 1.015 | 1.053 | 1.034 | 1.018 | 1.005 | 1.002 | 1.018 | 1.037 | 1.069 |
| 1997 | 1.063 | 1.048 | 1.014 | 1.000 | 0.986 | 0.982 | 0.977 | 1.031 | 1.055 | 1.032 | 1.001 | 0.963 |
| 1998 | 0.925 | 0.884 | 0.832 | 0.817 | 0.820 | 0.822 | 0.812 | 0.801 | 0.781 | 0.794 | 0.788 | 0.766 |
| 1999 | 0.750 | 0.727 | 0.742 | 0.847 | 0.865 | 0.870 | 0.916 | 0.984 | 1.026 | 1.052 | 1.066 | 1.087 |
| 2000 | 1.099 | 1.148 | 1.264 | 1.243 | 1.251 | 1.350 | 1.389 | 1.362 | 1.364 | 1.344 | 1.351 | 1.313 |
| 2001 | 1.294 | 1.271 | 1.240 | 1.338 | 1.506 | 1.488 | 1.342 | 1.233 | 1.200 | 1.106 | 0.971 | 0.879 |
| 2002 | 0.899 | 0.901 | 1.013 | 1.162 | 1.171 | 1.152 | 1.164 | 1.200 | 1.199 | 1.209 | 1.237 | 1.239 |
| 2003 | 1.276 | 1.400 | 1.437 | 1.373 | 1.288 | 1.266 | 1.274 | 1.384 | 1.519 | 1.418 | 1.323 | 1.285 |
| 2004 | 1.356 | 1.414 | 1.463 | 1.483 | 1.716 | 1.809 | 1.703 | 1.665 | 1.636 | 1.748 | 1.749 | 1.645 |
| 2005 | 1.595 | 1.658 | 1.764 | 1.942 | 1.920 | 1.949 | 2.135 | 2.351 | 2.841 | 2.467 | 1.981 | 1.943 |
| 2006 | 2.052 | 1.989 | 2.068 | 2.472 | 2.741 | 2.739 | 2.828 | 2.787 | 2.325 | 1.995 | 1.989 | 2.107 |
| 2007 | 2.035 | 2.110 | 2.399 | 2.641 | 2.805 | 2.819 | 2.760 | 2.598 | 2.540 | 2.565 | 2.844 | 2.865 |
| 2008 | 2.885 | 2.866 | 2.998 | 3.187 | 3.619 | 3.899 | 3.876 | 3.566 | 3.429 | 2.787 | 1.935 | 1.575 |
| 2009 | 1.569 | 1.718 | 1.742 | 1.831 | 2.094 | 2.470 | 2.406 | 2.490 | 2.449 | 2.391 | 2.461 | 2.434 |
| 2010 | 2.495 | 2.451 | 2.507 | 2.578 | 2.627 | 2.521 | 2.496 | 2.484 | 2.412 | 2.565 | 2.693 | 2.825 |
| 2011 | 2.908 | 2.976 | - | - | - | - | - | - | - | - | - | - |
| 2012 | - | - | - | - | - | - | - | - | - | - | - | - |
| 2013 | - | - | - | - | - | - | - | - | - | - | - | - |
| 2014 | - | - | - | - | - | - | - | - | - | - | - | - |
| 2015 | - | - | - | - | - | - | - | - | - | - | - | - |
| 2016 | - | - | - | - | - | - | - | - | - | - | - | - |
| 2017 | - | - | - | - | - | - | - | - | - | - | - | - |
| 2018 | - | - | - | - | - | - | - | - | - | - | - | - |
| 2019 | - | - | - | - | - | - | - | - | - | - | - | - |
| 2020 | - | - | - | - | - | - | - | - | - | - | - | - |
| 2021 | - | - | - | - | - | - | - | - | - | - | - | - |
| 2022 | - | - | - | |||||||||
| - = No Data Reported; -- = Not Applicable; NA = Not Available; W = Withheld to avoid disclosure of individual company data. |
| Release Date: 6/1/2022 |
| Next Release Date: TBD |