|
Download Data (XLS File) |
|
||||||||
|
||||||||
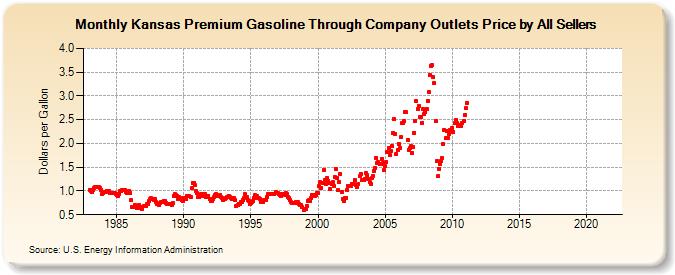
| Kansas Premium Gasoline Through Company Outlets Price by All Sellers (Dollars per Gallon) | ||||||||
| Year | Jan | Feb | Mar | Apr | May | Jun | Jul | Aug | Sep | Oct | Nov | Dec |
|---|---|---|---|---|---|---|---|---|---|---|---|---|
| 1983 | 1.026 | 0.998 | 0.968 | 1.016 | 1.072 | 1.075 | 1.092 | 1.081 | 1.074 | 1.062 | 1.027 | 0.946 |
| 1984 | 0.961 | 0.981 | 0.979 | 1.000 | 1.003 | 0.997 | 0.965 | 0.950 | 0.957 | 0.964 | 0.953 | 0.931 |
| 1985 | 0.906 | 0.894 | 0.942 | 0.998 | 0.998 | 1.029 | 1.029 | 1.016 | 0.987 | 0.951 | 0.972 | 1.006 |
| 1986 | 0.963 | 0.804 | 0.660 | 0.652 | 0.711 | NA | 0.643 | 0.637 | 0.706 | 0.652 | 0.667 | 0.615 |
| 1987 | 0.682 | 0.675 | 0.690 | 0.724 | 0.733 | 0.779 | 0.824 | 0.845 | 0.824 | 0.812 | 0.823 | 0.766 |
| 1988 | 0.728 | 0.721 | 0.713 | 0.748 | 0.775 | 0.767 | 0.798 | 0.790 | 0.747 | 0.721 | 0.732 | 0.727 |
| 1989 | 0.715 | 0.694 | 0.741 | 0.895 | 0.929 | 0.909 | 0.892 | 0.824 | 0.864 | 0.849 | 0.813 | 0.784 |
| 1990 | 0.862 | 0.826 | 0.826 | 0.886 | 0.895 | 0.887 | 0.869 | 1.059 | 1.175 | 1.176 | 1.116 | 0.990 |
| 1991 | 0.954 | 0.863 | 0.866 | 0.929 | 0.944 | 0.895 | 0.894 | 0.937 | 0.873 | 0.868 | 0.901 | 0.826 |
| 1992 | 0.787 | 0.791 | 0.825 | 0.868 | 0.917 | 0.928 | 0.889 | 0.898 | 0.905 | 0.883 | 0.857 | 0.804 |
| 1993 | 0.825 | 0.831 | 0.848 | 0.875 | 0.891 | 0.875 | 0.846 | 0.833 | 0.824 | 0.854 | 0.802 | 0.692 |
| 1994 | 0.701 | 0.731 | 0.733 | 0.765 | 0.773 | 0.820 | 0.858 | 0.929 | 0.869 | 0.810 | 0.793 | 0.734 |
| 1995 | 0.756 | 0.761 | 0.799 | 0.854 | 0.905 | 0.887 | 0.855 | 0.843 | 0.828 | 0.776 | 0.758 | 0.774 |
| 1996 | 0.802 | 0.805 | 0.870 | 0.933 | 0.939 | 0.945 | 0.928 | 0.933 | 0.937 | 0.944 | 0.974 | 0.955 |
| 1997 | 0.954 | 0.940 | 0.909 | 0.904 | 0.933 | 0.940 | 0.924 | 0.954 | 0.931 | 0.882 | 0.855 | 0.809 |
| 1998 | 0.760 | 0.755 | 0.740 | 0.753 | 0.767 | 0.757 | 0.761 | 0.733 | 0.714 | 0.709 | 0.665 | 0.589 |
| 1999 | 0.610 | 0.610 | 0.684 | 0.793 | 0.803 | 0.781 | 0.851 | 0.906 | 0.921 | 0.893 | 0.920 | 0.957 |
| 2000 | 0.961 | 1.094 | 1.188 | 1.067 | 1.168 | 1.440 | 1.240 | 1.154 | 1.274 | 1.217 | 1.161 | 1.035 |
| 2001 | 1.137 | 1.184 | 1.111 | 1.294 | 1.469 | 1.272 | 1.014 | 1.190 | 1.353 | 0.987 | 0.829 | 0.791 |
| 2002 | 0.855 | 0.860 | 1.027 | 1.111 | 1.094 | 1.095 | 1.147 | 1.136 | 1.136 | 1.221 | 1.132 | 1.091 |
| 2003 | 1.150 | 1.310 | 1.360 | 1.222 | 1.225 | 1.236 | 1.247 | 1.371 | 1.326 | 1.260 | 1.193 | 1.147 |
| 2004 | 1.276 | 1.323 | 1.410 | 1.479 | 1.702 | 1.596 | 1.600 | 1.575 | 1.559 | 1.679 | 1.589 | 1.449 |
| 2005 | 1.517 | 1.610 | 1.812 | 1.914 | 1.750 | 1.835 | 1.951 | 2.226 | 2.507 | 2.199 | 1.782 | 1.867 |
| 2006 | 1.998 | 1.907 | 2.126 | 2.422 | 2.438 | 2.480 | 2.666 | 2.653 | 2.069 | 1.868 | 1.894 | 1.951 |
| 2007 | 1.796 | 1.933 | 2.229 | 2.477 | 2.889 | 2.721 | 2.791 | 2.556 | 2.551 | 2.438 | 2.721 | 2.612 |
| 2008 | 2.667 | 2.731 | 2.902 | 3.082 | 3.432 | 3.633 | 3.650 | 3.392 | 3.268 | 2.473 | 1.625 | 1.307 |
| 2009 | 1.470 | 1.565 | 1.620 | 1.693 | 1.988 | 2.285 | 2.105 | 2.258 | 2.120 | 2.207 | 2.292 | 2.257 |
| 2010 | 2.334 | 2.243 | 2.424 | 2.496 | 2.434 | 2.359 | 2.383 | 2.371 | 2.377 | 2.437 | 2.475 | 2.600 |
| 2011 | 2.739 | 2.856 | - | - | - | - | - | - | - | - | - | - |
| 2012 | - | - | - | - | - | - | - | - | - | - | - | - |
| 2013 | - | - | - | - | - | - | - | - | - | - | - | - |
| 2014 | - | - | - | - | - | - | - | - | - | - | - | - |
| 2015 | - | - | - | - | - | - | - | - | - | - | - | - |
| 2016 | - | - | - | - | - | - | - | - | - | - | - | - |
| 2017 | - | - | - | - | - | - | - | - | - | - | - | - |
| 2018 | - | - | - | - | - | - | - | - | - | - | - | - |
| 2019 | - | - | - | - | - | - | - | - | - | - | - | - |
| 2020 | - | - | - | - | - | - | - | - | - | - | - | - |
| 2021 | - | - | - | - | - | - | - | - | - | - | - | - |
| 2022 | - | - | - | |||||||||
| - = No Data Reported; -- = Not Applicable; NA = Not Available; W = Withheld to avoid disclosure of individual company data. |
| Release Date: 6/1/2022 |
| Next Release Date: TBD |