|
Download Data (XLS File) |
|
||||||||
|
||||||||
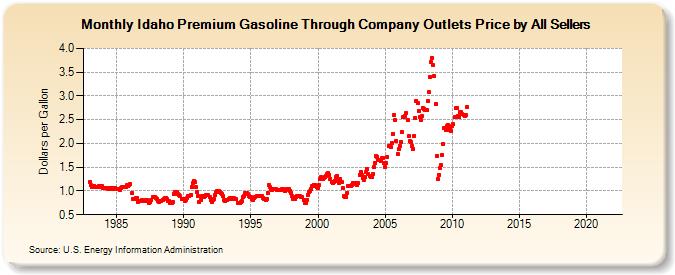
| Idaho Premium Gasoline Through Company Outlets Price by All Sellers (Dollars per Gallon) | ||||||||
| Year | Jan | Feb | Mar | Apr | May | Jun | Jul | Aug | Sep | Oct | Nov | Dec |
|---|---|---|---|---|---|---|---|---|---|---|---|---|
| 1983 | 1.196 | 1.116 | 1.074 | 1.085 | 1.112 | 1.079 | 1.086 | 1.084 | 1.097 | 1.106 | 1.091 | 1.095 |
| 1984 | 1.072 | 1.064 | 1.056 | 1.066 | 1.038 | 1.032 | 1.053 | 1.040 | 1.069 | 1.051 | 1.054 | 1.050 |
| 1985 | 1.045 | 1.039 | 1.043 | 1.023 | 1.054 | 1.085 | 1.081 | 1.088 | 1.085 | 1.115 | 1.110 | 1.117 |
| 1986 | 1.142 | NA | 0.949 | 0.836 | 0.823 | 0.854 | 0.851 | 0.778 | 0.786 | 0.795 | 0.781 | 0.808 |
| 1987 | 0.791 | 0.798 | 0.801 | 0.802 | 0.796 | 0.754 | 0.764 | 0.818 | 0.865 | 0.864 | 0.873 | 0.850 |
| 1988 | 0.826 | 0.793 | 0.778 | 0.785 | 0.799 | 0.816 | 0.824 | 0.848 | 0.858 | 0.823 | 0.799 | 0.780 |
| 1989 | 0.737 | 0.748 | 0.777 | 0.943 | 0.977 | 0.974 | 0.973 | 0.946 | 0.912 | 0.886 | 0.841 | 0.822 |
| 1990 | 0.834 | 0.799 | 0.811 | 0.859 | 0.892 | 0.893 | 0.909 | 1.086 | 1.166 | 1.219 | 1.188 | 1.073 |
| 1991 | 0.974 | 0.897 | 0.765 | 0.807 | 0.887 | 0.886 | 0.867 | 0.893 | 0.920 | 0.905 | 0.906 | 0.883 |
| 1992 | 0.810 | 0.769 | 0.810 | 0.839 | 0.912 | 0.968 | 0.996 | 0.999 | 0.981 | 0.957 | 0.934 | 0.888 |
| 1993 | 0.820 | 0.799 | 0.817 | 0.819 | 0.834 | 0.856 | 0.845 | 0.834 | 0.844 | 0.845 | 0.837 | 0.821 |
| 1994 | 0.757 | 0.736 | 0.740 | 0.759 | 0.796 | 0.870 | 0.901 | 0.948 | 0.947 | 0.926 | 0.898 | 0.878 |
| 1995 | 0.863 | 0.832 | 0.815 | 0.846 | 0.875 | 0.900 | 0.899 | 0.891 | 0.894 | 0.895 | 0.890 | 0.858 |
| 1996 | 0.824 | 0.817 | 0.827 | 0.965 | 1.124 | 1.084 | 1.035 | 1.023 | 1.034 | 1.035 | 1.035 | 1.011 |
| 1997 | 1.012 | 1.012 | 1.027 | 1.029 | 1.041 | 1.032 | 1.003 | 1.024 | 1.046 | 1.042 | 1.038 | 1.008 |
| 1998 | 0.957 | 0.888 | 0.840 | 0.824 | 0.883 | 0.889 | 0.886 | 0.886 | 0.888 | 0.875 | 0.864 | 0.801 |
| 1999 | 0.755 | 0.755 | 0.816 | 0.922 | 0.981 | 0.993 | 1.035 | 1.103 | 1.134 | 1.127 | 1.103 | 1.076 |
| 2000 | 1.069 | 1.124 | 1.262 | 1.284 | 1.255 | 1.277 | 1.298 | 1.308 | 1.360 | 1.380 | 1.346 | 1.252 |
| 2001 | 1.185 | 1.169 | 1.181 | 1.215 | 1.297 | 1.316 | 1.219 | 1.163 | 1.247 | 1.190 | 1.053 | 0.887 |
| 2002 | 0.874 | 0.878 | 0.962 | 1.108 | 1.097 | 1.098 | 1.127 | 1.163 | 1.167 | 1.163 | 1.154 | 1.130 |
| 2003 | 1.161 | 1.341 | 1.402 | 1.345 | 1.268 | 1.237 | 1.296 | 1.394 | 1.452 | 1.351 | 1.318 | 1.284 |
| 2004 | 1.298 | 1.364 | 1.497 | 1.592 | 1.741 | 1.719 | 1.660 | 1.649 | 1.640 | 1.687 | 1.698 | 1.595 |
| 2005 | 1.511 | 1.587 | 1.717 | 1.947 | 1.940 | 1.922 | 2.006 | 2.206 | 2.602 | 2.491 | 2.055 | 1.783 |
| 2006 | 1.877 | 1.948 | 2.035 | 2.245 | 2.548 | 2.560 | 2.571 | 2.638 | 2.492 | 2.149 | 2.041 | 2.022 |
| 2007 | 1.943 | 1.889 | 2.160 | 2.543 | 2.896 | 2.846 | 2.693 | 2.561 | 2.490 | 2.568 | 2.741 | 2.735 |
| 2008 | 2.694 | 2.699 | 2.888 | 3.074 | 3.408 | 3.709 | 3.807 | 3.649 | 3.422 | 2.830 | 1.737 | 1.248 |
| 2009 | 1.345 | 1.489 | 1.538 | 1.758 | 1.987 | 2.316 | 2.275 | 2.358 | 2.385 | 2.291 | 2.356 | 2.272 |
| 2010 | 2.370 | 2.402 | 2.553 | 2.740 | 2.741 | 2.578 | 2.560 | 2.651 | 2.655 | 2.610 | 2.600 | 2.585 |
| 2011 | 2.590 | 2.773 | - | - | - | - | - | - | - | - | - | - |
| 2012 | - | - | - | - | - | - | - | - | - | - | - | - |
| 2013 | - | - | - | - | - | - | - | - | - | - | - | - |
| 2014 | - | - | - | - | - | - | - | - | - | - | - | - |
| 2015 | - | - | - | - | - | - | - | - | - | - | - | - |
| 2016 | - | - | - | - | - | - | - | - | - | - | - | - |
| 2017 | - | - | - | - | - | - | - | - | - | - | - | - |
| 2018 | - | - | - | - | - | - | - | - | - | - | - | - |
| 2019 | - | - | - | - | - | - | - | - | - | - | - | - |
| 2020 | - | - | - | - | - | - | - | - | - | - | - | - |
| 2021 | - | - | - | - | - | - | - | - | - | - | - | - |
| 2022 | - | - | - | |||||||||
| - = No Data Reported; -- = Not Applicable; NA = Not Available; W = Withheld to avoid disclosure of individual company data. |
| Release Date: 6/1/2022 |
| Next Release Date: TBD |