|
Download Data (XLS File) |
|
||||||||
|
||||||||
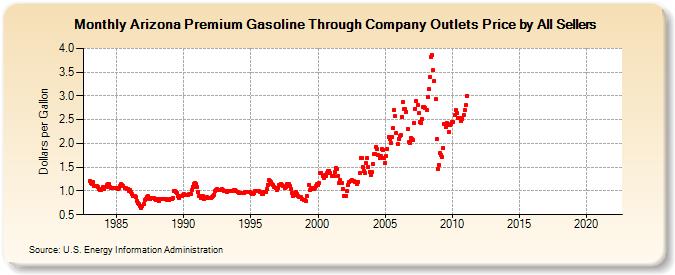
| Arizona Premium Gasoline Through Company Outlets Price by All Sellers (Dollars per Gallon) | ||||||||
| Year | Jan | Feb | Mar | Apr | May | Jun | Jul | Aug | Sep | Oct | Nov | Dec |
|---|---|---|---|---|---|---|---|---|---|---|---|---|
| 1983 | 1.215 | 1.173 | 1.142 | 1.179 | 1.110 | 1.095 | 1.108 | 1.085 | 1.051 | 1.021 | 1.023 | 1.044 |
| 1984 | 1.073 | 1.050 | 1.073 | 1.120 | 1.142 | 1.141 | 1.087 | 1.052 | 1.056 | 1.061 | 1.065 | 1.061 |
| 1985 | 1.056 | 1.047 | 1.062 | 1.114 | 1.141 | 1.134 | 1.102 | 1.062 | 1.052 | 1.051 | 1.041 | 1.009 |
| 1986 | 1.021 | 0.982 | 0.933 | 0.892 | 0.884 | 0.866 | 0.786 | 0.739 | 0.718 | 0.678 | 0.650 | 0.673 |
| 1987 | 0.723 | 0.816 | 0.839 | 0.876 | 0.887 | 0.855 | 0.841 | 0.848 | 0.844 | 0.844 | 0.824 | 0.812 |
| 1988 | 0.828 | 0.805 | 0.794 | 0.829 | 0.833 | 0.833 | 0.838 | 0.828 | 0.832 | 0.819 | 0.813 | 0.803 |
| 1989 | 0.823 | 0.821 | 0.855 | 0.995 | 1.000 | 0.982 | 0.950 | 0.885 | 0.852 | 0.887 | 0.900 | 0.914 |
| 1990 | 0.933 | 0.912 | 0.912 | 0.915 | 0.912 | 0.930 | 0.941 | 1.015 | 1.091 | 1.153 | 1.176 | 1.154 |
| 1991 | 1.079 | 0.980 | 0.894 | 0.854 | 0.886 | 0.885 | 0.840 | 0.846 | 0.859 | 0.863 | 0.854 | 0.854 |
| 1992 | 0.860 | 0.863 | 0.889 | 0.924 | 0.989 | 1.029 | 1.039 | 1.028 | 1.016 | 1.030 | 1.035 | 1.022 |
| 1993 | 1.005 | 1.005 | 0.993 | 0.979 | 0.995 | 0.995 | 1.000 | 1.000 | 1.007 | 1.022 | 1.016 | 1.000 |
| 1994 | 0.987 | 0.964 | 0.962 | 0.956 | 0.955 | 0.956 | 0.958 | 0.975 | 0.984 | 0.985 | 0.983 | 0.971 |
| 1995 | 0.964 | 0.943 | 0.943 | 0.951 | 0.993 | 1.007 | 1.002 | 0.994 | 0.985 | 0.976 | 0.926 | 0.941 |
| 1996 | 0.973 | 0.983 | 1.034 | 1.134 | 1.225 | 1.215 | 1.185 | 1.155 | 1.118 | 1.091 | 1.065 | 1.023 |
| 1997 | 1.071 | 1.128 | 1.135 | 1.150 | 1.131 | 1.096 | 1.061 | 1.084 | 1.140 | 1.155 | 1.138 | 1.098 |
| 1998 | 1.036 | 0.959 | 0.890 | 0.925 | 0.973 | 0.941 | 0.903 | 0.880 | 0.871 | 0.867 | 0.829 | 0.806 |
| 1999 | 0.818 | 0.782 | 0.899 | NA | 1.135 | 1.025 | 1.042 | 1.071 | 1.048 | 1.070 | 1.097 | 1.141 |
| 2000 | 1.134 | 1.164 | 1.368 | 1.387 | 1.307 | 1.281 | 1.326 | 1.319 | 1.376 | 1.412 | 1.430 | 1.382 |
| 2001 | 1.325 | 1.322 | 1.324 | 1.389 | 1.490 | 1.454 | 1.309 | 1.166 | 1.221 | 1.160 | 1.043 | 0.899 |
| 2002 | 0.898 | 0.898 | 1.002 | 1.129 | 1.178 | 1.219 | 1.230 | 1.207 | 1.200 | 1.187 | 1.190 | 1.154 |
| 2003 | 1.190 | 1.381 | 1.700 | 1.695 | 1.509 | 1.429 | 1.380 | 1.581 | 1.692 | 1.499 | 1.403 | 1.346 |
| 2004 | 1.394 | 1.568 | 1.775 | 1.787 | 1.934 | 1.875 | 1.747 | 1.698 | 1.740 | 1.879 | 1.864 | 1.688 |
| 2005 | 1.595 | 1.726 | 1.885 | 2.130 | 2.090 | 2.011 | 2.138 | 2.320 | 2.699 | 2.576 | 2.224 | 1.983 |
| 2006 | 2.088 | 2.146 | 2.167 | 2.551 | 2.866 | 2.730 | 2.724 | 2.660 | 2.304 | 2.029 | 2.014 | 2.121 |
| 2007 | 2.096 | 2.065 | 2.432 | 2.730 | 2.890 | 2.811 | 2.645 | 2.443 | 2.425 | 2.517 | 2.765 | 2.770 |
| 2008 | 2.744 | 2.707 | 2.987 | 3.139 | 3.408 | 3.829 | 3.853 | 3.538 | 3.314 | 2.927 | 2.092 | 1.462 |
| 2009 | 1.552 | 1.798 | 1.760 | 1.704 | 1.906 | 2.409 | 2.338 | 2.440 | 2.382 | 2.251 | 2.391 | 2.406 |
| 2010 | 2.458 | 2.456 | 2.592 | 2.696 | 2.631 | 2.530 | 2.534 | 2.538 | 2.471 | 2.520 | 2.595 | 2.694 |
| 2011 | 2.800 | 3.007 | - | - | - | - | - | - | - | - | - | - |
| 2012 | - | - | - | - | - | - | - | - | - | - | - | - |
| 2013 | - | - | - | - | - | - | - | - | - | - | - | - |
| 2014 | - | - | - | - | - | - | - | - | - | - | - | - |
| 2015 | - | - | - | - | - | - | - | - | - | - | - | - |
| 2016 | - | - | - | - | - | - | - | - | - | - | - | - |
| 2017 | - | - | - | - | - | - | - | - | - | - | - | - |
| 2018 | - | - | - | - | - | - | - | - | - | - | - | - |
| 2019 | - | - | - | - | - | - | - | - | - | - | - | - |
| 2020 | - | - | - | - | - | - | - | - | - | - | - | - |
| 2021 | - | - | - | - | - | - | - | - | - | - | - | - |
| 2022 | - | - | - | |||||||||
| - = No Data Reported; -- = Not Applicable; NA = Not Available; W = Withheld to avoid disclosure of individual company data. |
| Release Date: 6/1/2022 |
| Next Release Date: TBD |