|
Download Data (XLS File) |
|
||||||||
|
||||||||
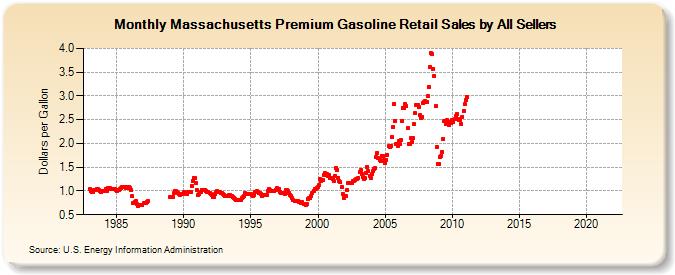
| Massachusetts Premium Gasoline Retail Sales by All Sellers (Dollars per Gallon) | ||||||||
| Year | Jan | Feb | Mar | Apr | May | Jun | Jul | Aug | Sep | Oct | Nov | Dec |
|---|---|---|---|---|---|---|---|---|---|---|---|---|
| 1983 | 1.034 | 1.002 | 0.969 | 0.983 | 1.015 | 1.022 | 1.032 | 1.032 | 1.022 | 1.005 | 0.987 | NA |
| 1984 | 1.003 | 1.006 | 1.033 | 1.008 | 1.067 | 1.064 | 1.052 | 1.044 | 1.042 | 1.037 | 1.033 | 1.028 |
| 1985 | 1.006 | 1.014 | 1.027 | 1.040 | 1.061 | 1.078 | 1.081 | 1.084 | 1.068 | 1.070 | 1.080 | 1.079 |
| 1986 | 1.061 | 1.017 | 0.886 | 0.750 | 0.771 | 0.784 | 0.716 | 0.688 | 0.695 | 0.699 | 0.709 | 0.714 |
| 1987 | 0.739 | 0.745 | 0.749 | 0.766 | 0.780 | |||||||
| 1988 | NA | NA | NA | NA | NA | NA | NA | NA | NA | NA | NA | NA |
| 1989 | 0.875 | 0.875 | 0.879 | 0.951 | 0.994 | 0.991 | 0.985 | 0.957 | 0.931 | 0.923 | 0.927 | 0.933 |
| 1990 | 0.971 | 0.963 | 0.949 | 0.944 | 0.979 | 0.976 | 0.977 | 1.114 | 1.210 | 1.283 | 1.272 | 1.160 |
| 1991 | 1.017 | 0.923 | 0.926 | 0.979 | 1.026 | 1.030 | 1.012 | 1.025 | 1.005 | 0.980 | 0.981 | 0.953 |
| 1992 | 0.936 | 0.905 | 0.877 | 0.883 | 0.937 | 0.987 | 0.990 | 0.985 | 0.978 | 0.963 | 0.966 | 0.938 |
| 1993 | 0.920 | 0.899 | 0.889 | 0.884 | 0.908 | 0.911 | 0.900 | 0.890 | 0.869 | 0.862 | 0.838 | 0.808 |
| 1994 | 0.809 | 0.807 | 0.803 | 0.817 | 0.842 | 0.864 | 0.895 | 0.948 | 0.936 | 0.931 | 0.934 | 0.928 |
| 1995 | 0.927 | 0.921 | 0.903 | 0.920 | 0.977 | 0.993 | 0.978 | 0.960 | 0.954 | 0.931 | 0.898 | 0.911 |
| 1996 | 0.918 | 0.906 | 0.922 | 1.000 | 1.036 | 1.014 | 1.001 | 0.990 | 0.989 | 1.003 | 1.026 | 1.056 |
| 1997 | 1.049 | 1.036 | 0.979 | 0.963 | 0.959 | 0.947 | 0.946 | 1.012 | 1.016 | 0.993 | 0.963 | 0.925 |
| 1998 | 0.885 | 0.847 | 0.802 | 0.795 | 0.799 | 0.798 | 0.788 | 0.773 | 0.760 | 0.749 | 0.759 | 0.733 |
| 1999 | 0.721 | 0.699 | 0.716 | 0.830 | 0.847 | 0.851 | 0.902 | 0.967 | 1.009 | 1.032 | 1.046 | 1.069 |
| 2000 | 1.081 | 1.124 | 1.249 | 1.213 | 1.232 | 1.334 | 1.370 | 1.337 | 1.347 | 1.324 | 1.334 | 1.283 |
| 2001 | 1.270 | 1.249 | 1.216 | 1.323 | 1.481 | 1.442 | 1.283 | 1.208 | 1.180 | 1.080 | 0.941 | 0.862 |
| 2002 | 0.884 | 0.885 | 1.016 | 1.163 | 1.169 | 1.162 | 1.170 | 1.203 | 1.206 | 1.225 | 1.246 | 1.251 |
| 2003 | 1.276 | 1.397 | 1.431 | 1.366 | 1.285 | 1.261 | 1.268 | 1.382 | 1.510 | 1.410 | 1.317 | 1.281 |
| 2004 | 1.352 | 1.413 | 1.459 | 1.480 | 1.710 | 1.797 | 1.692 | 1.658 | 1.633 | 1.745 | 1.743 | 1.641 |
| 2005 | 1.593 | 1.655 | 1.763 | 1.938 | 1.917 | 1.949 | 2.134 | 2.350 | 2.836 | 2.462 | 1.979 | 1.944 |
| 2006 | 2.054 | 1.988 | 2.070 | 2.475 | 2.742 | 2.742 | 2.833 | 2.787 | 2.323 | 1.995 | 1.990 | 2.108 |
| 2007 | 2.034 | 2.108 | 2.399 | 2.640 | 2.803 | 2.817 | 2.759 | 2.597 | 2.539 | 2.564 | 2.842 | 2.862 |
| 2008 | 2.883 | 2.865 | 2.997 | 3.187 | 3.617 | 3.896 | 3.873 | 3.562 | 3.427 | 2.782 | 1.932 | 1.573 |
| 2009 | 1.570 | 1.717 | 1.742 | 1.830 | 2.095 | 2.468 | 2.403 | 2.490 | 2.445 | 2.389 | 2.459 | 2.431 |
| 2010 | 2.492 | 2.449 | 2.506 | 2.577 | 2.625 | 2.519 | 2.495 | 2.483 | 2.411 | 2.565 | 2.692 | 2.824 |
| 2011 | 2.905 | 2.974 | - | - | - | - | - | - | - | - | - | - |
| 2012 | - | - | - | - | - | - | - | - | - | - | - | - |
| 2013 | - | - | - | - | - | - | - | - | - | - | - | - |
| 2014 | - | - | - | - | - | - | - | - | - | - | - | - |
| 2015 | - | - | - | - | - | - | - | - | - | - | - | - |
| 2016 | - | - | - | - | - | - | - | - | - | - | - | - |
| 2017 | - | - | - | - | - | - | - | - | - | - | - | - |
| 2018 | - | - | - | - | - | - | - | - | - | - | - | - |
| 2019 | - | - | - | - | - | - | - | - | - | - | - | - |
| 2020 | - | - | - | - | - | - | - | - | - | - | - | - |
| 2021 | - | - | - | - | - | - | - | - | - | - | - | - |
| 2022 | - | - | - | |||||||||
| - = No Data Reported; -- = Not Applicable; NA = Not Available; W = Withheld to avoid disclosure of individual company data. |
| Release Date: 6/1/2022 |
| Next Release Date: TBD |