|
Download Data (XLS File) |
|
||||||||
|
||||||||
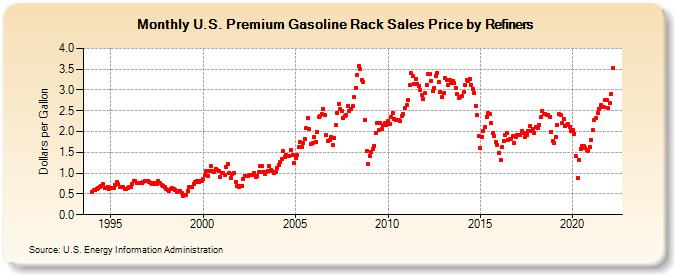
| U.S. Premium Gasoline Rack Sales Price by Refiners (Dollars per Gallon) | ||||||||
| Year | Jan | Feb | Mar | Apr | May | Jun | Jul | Aug | Sep | Oct | Nov | Dec |
|---|---|---|---|---|---|---|---|---|---|---|---|---|
| 1994 | 0.558 | 0.587 | 0.593 | 0.628 | 0.640 | 0.676 | 0.702 | 0.729 | 0.636 | 0.651 | 0.658 | 0.607 |
| 1995 | 0.637 | 0.645 | 0.642 | 0.723 | 0.783 | 0.731 | 0.667 | 0.670 | 0.677 | 0.628 | 0.626 | 0.649 |
| 1996 | 0.657 | 0.666 | 0.733 | 0.819 | 0.821 | 0.761 | 0.767 | 0.759 | 0.770 | 0.792 | 0.817 | 0.801 |
| 1997 | 0.817 | 0.786 | 0.763 | 0.750 | 0.768 | 0.731 | 0.735 | 0.812 | 0.766 | 0.726 | 0.696 | 0.655 |
| 1998 | 0.615 | 0.600 | 0.576 | 0.609 | 0.637 | 0.611 | 0.597 | 0.553 | 0.559 | 0.579 | 0.515 | 0.456 |
| 1999 | 0.482 | 0.465 | 0.567 | 0.667 | 0.662 | 0.664 | 0.740 | 0.788 | 0.818 | 0.777 | 0.818 | 0.821 |
| 2000 | 0.850 | 0.954 | 1.043 | 0.921 | 1.053 | 1.170 | 1.050 | 1.030 | 1.104 | 1.071 | 1.053 | 0.912 |
| 2001 | 1.005 | 0.998 | 0.962 | 1.140 | 1.214 | 1.013 | 0.874 | 0.977 | 1.006 | 0.784 | 0.685 | 0.658 |
| 2002 | 0.687 | 0.695 | 0.858 | 0.943 | 0.930 | 0.923 | 0.951 | 0.948 | 0.963 | 1.014 | 0.910 | 0.934 |
| 2003 | 1.024 | 1.172 | 1.171 | 1.029 | 0.990 | 1.025 | 1.059 | 1.180 | 1.071 | 1.048 | 1.012 | 1.016 |
| 2004 | 1.131 | 1.198 | 1.267 | 1.331 | 1.531 | 1.400 | 1.430 | 1.405 | 1.420 | 1.546 | 1.448 | 1.251 |
| 2005 | 1.374 | 1.426 | 1.633 | 1.740 | 1.620 | 1.715 | 1.825 | 2.075 | 2.318 | 2.060 | 1.690 | 1.719 |
| 2006 | 1.870 | 1.751 | 1.994 | 2.343 | 2.381 | 2.424 | 2.547 | 2.397 | 1.915 | 1.771 | 1.807 | 1.865 |
| 2007 | 1.686 | 1.856 | 2.148 | 2.452 | 2.672 | 2.540 | 2.492 | 2.333 | 2.385 | 2.393 | 2.625 | 2.506 |
| 2008 | 2.542 | 2.605 | 2.823 | 3.052 | 3.369 | 3.582 | 3.500 | 3.245 | 3.187 | 2.288 | 1.537 | 1.216 |
| 2009 | 1.420 | 1.503 | 1.574 | 1.661 | 1.957 | 2.204 | 2.034 | 2.202 | 2.068 | 2.147 | 2.196 | 2.158 |
| 2010 | 2.250 | 2.193 | 2.362 | 2.437 | 2.305 | 2.288 | 2.285 | 2.268 | 2.260 | 2.374 | 2.418 | 2.555 |
| 2011 | 2.631 | 2.756 | 3.109 | 3.406 | 3.343 | 3.149 | 3.261 | 3.146 | 3.089 | 2.988 | 2.875 | 2.789 |
| 2012 | 2.932 | 3.116 | 3.390 | 3.389 | 3.222 | 2.971 | 3.057 | 3.344 | 3.418 | 3.190 | 2.950 | 2.822 |
| 2013 | 2.918 | 3.286 | 3.239 | 3.120 | 3.232 | 3.164 | 3.227 | 3.166 | 3.058 | 2.893 | 2.803 | 2.839 |
| 2014 | 2.843 | 2.951 | 3.117 | 3.243 | 3.210 | 3.269 | 3.126 | 3.027 | 2.936 | 2.612 | 2.389 | 1.889 |
| 2015 | 1.615 | 1.881 | 2.021 | 2.105 | 2.354 | 2.439 | 2.422 | 2.214 | 1.969 | 1.889 | 1.741 | 1.667 |
| 2016 | 1.473 | 1.322 | 1.633 | 1.779 | 1.928 | 1.956 | 1.788 | 1.813 | 1.827 | 1.884 | 1.729 | 1.871 |
| 2017 | 1.908 | 1.908 | 1.921 | 2.015 | 1.963 | 1.860 | 1.912 | 2.008 | 2.129 | 2.009 | 2.070 | 1.976 |
| 2018 | 2.115 | 2.087 | 2.166 | 2.342 | 2.492 | 2.420 | 2.434 | 2.397 | 2.410 | 2.361 | 1.998 | 1.766 |
| 2019 | 1.734 | 1.877 | 2.148 | 2.417 | 2.401 | 2.199 | 2.297 | 2.126 | 2.164 | 2.175 | 2.118 | 2.024 |
| 2020 | 2.026 | 1.950 | 1.403 | 0.894 | 1.322 | 1.585 | 1.652 | 1.652 | 1.607 | 1.552 | 1.528 | 1.631 |
| 2021 | 1.807 | 2.026 | 2.276 | 2.320 | 2.452 | 2.537 | 2.638 | 2.594 | 2.584 | 2.757 | 2.755 | 2.559 |
| 2022 | 2.676 | 2.907 | 3.539 | |||||||||
| - = No Data Reported; -- = Not Applicable; NA = Not Available; W = Withheld to avoid disclosure of individual company data. |
| Release Date: 6/1/2022 |
| Next Release Date: TBD |