|
Download Data (XLS File) |
|
||||||||
|
||||||||
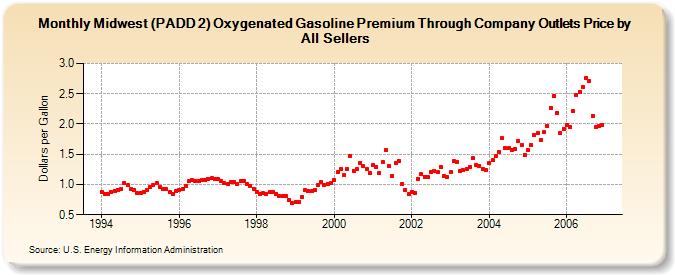
| Midwest (PADD 2) Oxygenated Gasoline Premium Through Company Outlets Price by All Sellers (Dollars per Gallon) | ||||||||
| Year | Jan | Feb | Mar | Apr | May | Jun | Jul | Aug | Sep | Oct | Nov | Dec |
|---|---|---|---|---|---|---|---|---|---|---|---|---|
| 1994 | 0.883 | 0.848 | 0.837 | 0.874 | 0.888 | 0.915 | 0.928 | 1.024 | 0.988 | 0.918 | 0.916 | 0.858 |
| 1995 | 0.867 | 0.874 | 0.913 | 0.955 | 0.994 | 1.017 | 0.964 | 0.923 | 0.918 | 0.871 | 0.850 | 0.890 |
| 1996 | 0.915 | 0.924 | 0.977 | 1.051 | 1.073 | 1.060 | 1.059 | 1.068 | 1.076 | 1.093 | 1.099 | 1.091 |
| 1997 | 1.085 | 1.055 | 1.020 | 1.007 | 1.042 | 1.035 | 1.003 | 1.056 | 1.054 | 1.007 | 0.982 | 0.928 |
| 1998 | 0.871 | 0.847 | 0.853 | 0.845 | 0.872 | 0.873 | 0.850 | 0.814 | 0.807 | 0.814 | 0.745 | 0.701 |
| 1999 | 0.715 | 0.710 | 0.789 | 0.905 | 0.896 | 0.884 | 0.910 | 0.985 | 1.038 | 0.995 | 1.014 | 1.023 |
| 2000 | 1.072 | 1.198 | 1.249 | 1.149 | 1.257 | 1.474 | 1.229 | 1.254 | 1.361 | 1.301 | 1.259 | 1.197 |
| 2001 | 1.316 | 1.295 | 1.195 | 1.369 | 1.568 | 1.313 | 1.146 | 1.355 | 1.393 | 1.011 | 0.916 | 0.839 |
| 2002 | 0.880 | 0.864 | 1.095 | 1.172 | 1.131 | 1.118 | 1.210 | 1.220 | 1.202 | 1.295 | 1.148 | 1.126 |
| 2003 | 1.204 | 1.380 | 1.369 | 1.225 | 1.232 | 1.258 | 1.296 | 1.433 | 1.329 | 1.308 | 1.252 | 1.241 |
| 2004 | 1.351 | 1.408 | 1.465 | 1.543 | 1.761 | 1.609 | 1.597 | 1.575 | 1.588 | 1.716 | 1.653 | 1.492 |
| 2005 | 1.572 | 1.645 | 1.816 | 1.844 | 1.739 | 1.862 | 1.970 | 2.270 | 2.461 | 2.187 | 1.854 | 1.914 |
| 2006 | 1.979 | 1.949 | 2.208 | 2.482 | 2.534 | 2.615 | 2.758 | 2.710 | 2.133 | 1.953 | 1.965 | 1.988 |
| - = No Data Reported; -- = Not Applicable; NA = Not Available; W = Withheld to avoid disclosure of individual company data. |
| Release Date: 6/1/2022 |
| Next Release Date: TBD |