|
Download Data (XLS File) |
|
||||||||
|
||||||||
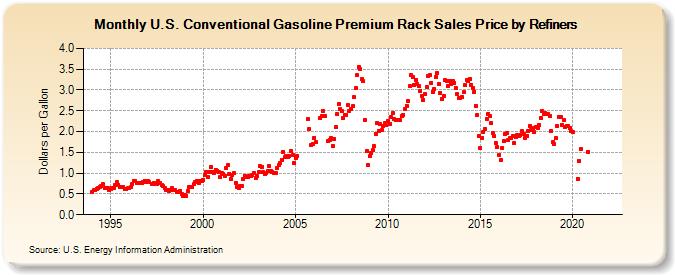
| U.S. Conventional Gasoline Premium Rack Sales Price by Refiners (Dollars per Gallon) | ||||||||
| Year | Jan | Feb | Mar | Apr | May | Jun | Jul | Aug | Sep | Oct | Nov | Dec |
|---|---|---|---|---|---|---|---|---|---|---|---|---|
| 1994 | 0.552 | 0.584 | 0.592 | 0.628 | 0.640 | 0.676 | 0.702 | 0.729 | 0.635 | 0.642 | 0.646 | 0.584 |
| 1995 | 0.621 | 0.632 | 0.636 | 0.720 | 0.778 | 0.724 | 0.660 | 0.665 | 0.670 | 0.617 | 0.613 | 0.635 |
| 1996 | 0.646 | 0.658 | 0.729 | 0.810 | 0.811 | 0.753 | 0.759 | 0.752 | 0.764 | 0.787 | 0.813 | 0.793 |
| 1997 | 0.810 | 0.780 | W | 0.745 | 0.764 | 0.728 | 0.731 | 0.804 | 0.755 | 0.715 | 0.684 | 0.643 |
| 1998 | 0.603 | 0.592 | 0.569 | 0.604 | 0.631 | 0.606 | 0.592 | 0.547 | 0.553 | 0.573 | 0.504 | 0.445 |
| 1999 | 0.473 | 0.457 | 0.559 | 0.660 | 0.656 | 0.656 | 0.731 | 0.779 | 0.812 | 0.768 | 0.810 | 0.812 |
| 2000 | 0.845 | 0.953 | 1.031 | 0.905 | 1.035 | 1.154 | 1.029 | 1.005 | 1.085 | 1.053 | 1.037 | 0.897 |
| 2001 | 0.997 | 0.985 | 0.942 | 1.113 | 1.186 | 0.991 | 0.863 | 0.966 | 0.995 | 0.769 | 0.675 | 0.651 |
| 2002 | 0.680 | 0.684 | 0.848 | 0.933 | 0.919 | 0.913 | 0.942 | 0.938 | 0.955 | 1.009 | 0.894 | 0.926 |
| 2003 | 1.017 | 1.165 | 1.153 | 1.016 | 0.979 | 1.009 | 1.052 | 1.165 | 1.050 | 1.034 | 0.999 | 1.007 |
| 2004 | 1.126 | 1.184 | 1.255 | 1.320 | 1.512 | 1.378 | 1.414 | 1.389 | 1.405 | 1.529 | 1.437 | 1.244 |
| 2005 | 1.371 | 1.415 | W | W | W | W | W | W | 2.290 | 2.057 | 1.675 | 1.710 |
| 2006 | 1.855 | 1.739 | W | W | 2.315 | 2.364 | 2.494 | 2.368 | W | 1.762 | 1.794 | 1.846 |
| 2007 | 1.654 | 1.821 | 2.105 | 2.420 | 2.658 | 2.535 | 2.488 | 2.337 | 2.400 | 2.396 | 2.632 | 2.504 |
| 2008 | 2.552 | 2.613 | 2.819 | 3.039 | 3.360 | 3.556 | 3.499 | 3.258 | 3.206 | 2.284 | 1.529 | 1.199 |
| 2009 | 1.401 | 1.480 | 1.561 | 1.645 | 1.947 | 2.195 | 2.020 | 2.182 | 2.049 | 2.140 | 2.198 | 2.149 |
| 2010 | 2.250 | 2.193 | 2.360 | 2.435 | 2.299 | 2.276 | 2.276 | 2.269 | 2.270 | 2.369 | 2.405 | 2.544 |
| 2011 | 2.626 | 2.744 | 3.089 | 3.368 | 3.316 | 3.121 | 3.248 | 3.147 | 3.086 | 2.984 | 2.863 | 2.769 |
| 2012 | 2.898 | 3.068 | 3.345 | 3.354 | 3.177 | 2.960 | 3.028 | 3.313 | 3.399 | 3.150 | 2.930 | 2.782 |
| 2013 | 2.863 | 3.242 | 3.211 | 3.094 | 3.218 | 3.149 | 3.212 | 3.174 | 3.049 | 2.897 | 2.799 | 2.814 |
| 2014 | 2.839 | 2.946 | 3.110 | 3.231 | 3.209 | 3.262 | 3.127 | 3.050 | 2.959 | 2.626 | 2.402 | 1.889 |
| 2015 | 1.615 | 1.854 | 1.986 | 2.071 | 2.308 | 2.432 | 2.375 | 2.203 | 1.968 | 1.885 | 1.725 | 1.630 |
| 2016 | 1.441 | 1.315 | 1.612 | 1.763 | 1.935 | 1.955 | 1.787 | 1.837 | 1.846 | 1.901 | 1.733 | 1.875 |
| 2017 | 1.908 | 1.899 | 1.916 | 2.005 | 1.950 | 1.851 | 1.902 | 2.014 | 2.137 | 2.027 | 2.083 | 1.987 |
| 2018 | 2.121 | 2.086 | 2.154 | 2.337 | 2.487 | 2.425 | 2.439 | 2.418 | 2.420 | 2.366 | 2.010 | 1.745 |
| 2019 | 1.704 | 1.842 | 2.125 | 2.359 | 2.353 | 2.169 | 2.279 | 2.114 | 2.134 | 2.130 | 2.095 | 2.005 |
| 2020 | 1.988 | W | W | 0.869 | 1.299 | 1.577 | W | W | W | W | 1.515 | W |
| 2021 | W | W | W | W | W | W | W | W | W | W | W | W |
| 2022 | W | W | W | |||||||||
| - = No Data Reported; -- = Not Applicable; NA = Not Available; W = Withheld to avoid disclosure of individual company data. |
| Release Date: 6/1/2022 |
| Next Release Date: TBD |