|
Download Data (XLS File) |
|
||||||||
|
||||||||
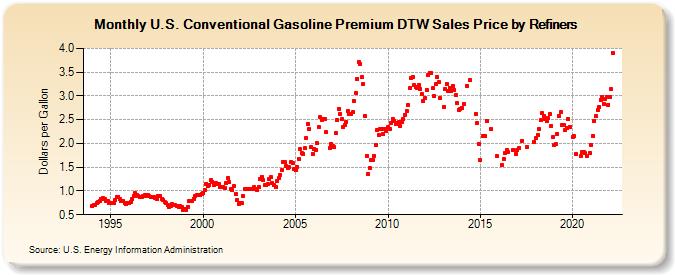
| U.S. Conventional Gasoline Premium DTW Sales Price by Refiners (Dollars per Gallon) | ||||||||
| Year | Jan | Feb | Mar | Apr | May | Jun | Jul | Aug | Sep | Oct | Nov | Dec |
|---|---|---|---|---|---|---|---|---|---|---|---|---|
| 1994 | 0.685 | 0.708 | 0.714 | 0.741 | 0.758 | 0.794 | 0.821 | 0.851 | 0.831 | 0.790 | 0.788 | 0.740 |
| 1995 | 0.745 | 0.755 | 0.756 | 0.807 | 0.872 | 0.875 | 0.830 | 0.794 | 0.787 | 0.742 | 0.715 | 0.736 |
| 1996 | 0.753 | 0.773 | 0.828 | 0.900 | 0.947 | 0.920 | 0.894 | 0.876 | 0.882 | 0.893 | 0.914 | 0.904 |
| 1997 | 0.907 | 0.887 | 0.863 | 0.864 | 0.864 | 0.855 | 0.835 | 0.893 | 0.884 | 0.840 | 0.810 | 0.766 |
| 1998 | 0.739 | 0.699 | 0.672 | 0.688 | 0.717 | W | 0.703 | 0.677 | 0.664 | 0.676 | 0.652 | 0.607 |
| 1999 | 0.618 | 0.600 | 0.663 | 0.793 | 0.798 | 0.785 | 0.837 | 0.889 | 0.922 | 0.908 | 0.924 | 0.943 |
| 2000 | 0.957 | 1.027 | 1.152 | 1.106 | 1.131 | 1.228 | 1.194 | 1.115 | 1.166 | 1.151 | 1.140 | 1.080 |
| 2001 | 1.088 | 1.086 | 1.054 | 1.165 | 1.269 | 1.188 | 1.037 | 1.028 | 1.098 | 0.940 | 0.819 | 0.730 |
| 2002 | 0.747 | 0.743 | 0.891 | 1.038 | 1.033 | 1.032 | 1.043 | 1.037 | 1.039 | 1.078 | 1.047 | 1.018 |
| 2003 | 1.086 | 1.244 | 1.303 | 1.222 | 1.119 | 1.126 | 1.139 | 1.258 | 1.286 | 1.167 | 1.117 | 1.085 |
| 2004 | 1.207 | 1.267 | 1.344 | 1.434 | 1.616 | 1.600 | 1.519 | 1.493 | 1.498 | 1.607 | 1.580 | 1.459 |
| 2005 | 1.437 | 1.504 | 1.670 | 1.875 | 1.806 | 1.787 | 1.900 | 2.105 | 2.417 | 2.295 | 1.919 | 1.782 |
| 2006 | 1.890 | 1.866 | 1.999 | 2.342 | 2.550 | 2.496 | 2.517 | 2.514 | 2.232 | W | 1.913 | 1.994 |
| 2007 | 1.937 | 1.918 | 2.215 | 2.501 | 2.731 | 2.618 | 2.514 | 2.353 | 2.392 | 2.461 | 2.684 | 2.628 |
| 2008 | 2.624 | 2.655 | 2.896 | 3.062 | 3.360 | 3.711 | 3.671 | 3.397 | 3.256 | 2.581 | 1.740 | 1.360 |
| 2009 | 1.488 | 1.647 | 1.655 | 1.742 | 1.961 | 2.282 | 2.173 | 2.302 | 2.295 | 2.201 | 2.302 | 2.263 |
| 2010 | 2.354 | 2.312 | 2.437 | 2.519 | 2.464 | 2.408 | 2.436 | 2.444 | 2.364 | 2.460 | 2.507 | 2.607 |
| 2011 | 2.687 | 2.807 | 3.161 | 3.385 | 3.392 | 3.225 | 3.182 | 3.156 | 3.240 | 3.146 | 3.033 | 2.888 |
| 2012 | 2.952 | 3.132 | 3.437 | 3.486 | 3.489 | 3.157 | 2.994 | 3.249 | 3.394 | 3.286 | 2.951 | W |
| 2013 | 2.777 | 3.138 | 3.250 | 3.095 | 3.174 | 3.101 | 3.218 | 3.129 | 3.020 | 2.845 | 2.711 | 2.730 |
| 2014 | 2.753 | 2.832 | W | 3.204 | W | 3.336 | W | W | W | 2.618 | 2.433 | 1.996 |
| 2015 | 1.648 | W | 2.157 | 2.156 | 2.473 | W | W | 2.302 | W | W | W | 1.726 |
| 2016 | W | W | 1.548 | 1.674 | 1.809 | 1.862 | 1.812 | W | W | 1.860 | W | 1.774 |
| 2017 | 1.866 | 1.911 | W | 2.059 | W | W | 1.931 | W | W | W | W | 2.039 |
| 2018 | 2.118 | 2.176 | 2.298 | 2.484 | 2.632 | 2.570 | 2.522 | 2.477 | 2.526 | 2.617 | 2.373 | 2.133 |
| 2019 | 1.961 | 1.982 | 2.207 | 2.575 | 2.661 | 2.395 | 2.387 | 2.275 | 2.333 | 2.509 | 2.353 | W |
| 2020 | 2.138 | 2.146 | 1.768 | W | W | 1.733 | 1.813 | 1.829 | 1.789 | 1.730 | W | 1.809 |
| 2021 | 1.965 | 2.161 | 2.467 | 2.578 | 2.699 | 2.768 | 2.914 | 2.987 | 2.840 | 2.935 | 2.974 | 2.816 |
| 2022 | 2.978 | 3.140 | 3.905 | |||||||||
| - = No Data Reported; -- = Not Applicable; NA = Not Available; W = Withheld to avoid disclosure of individual company data. |
| Release Date: 6/1/2022 |
| Next Release Date: TBD |
Referring Pages: