|
Download Data (XLS File) |
|
||||||||
|
||||||||
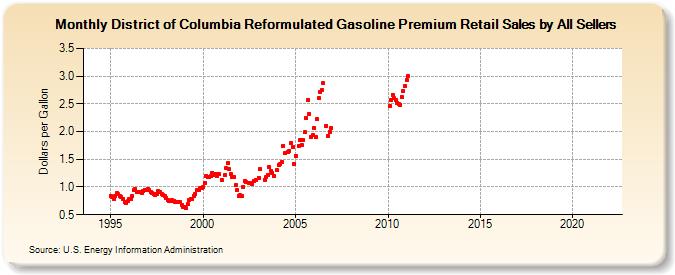
| District of Columbia Reformulated Gasoline Premium Retail Sales by All Sellers (Dollars per Gallon) | ||||||||
| Year | Jan | Feb | Mar | Apr | May | Jun | Jul | Aug | Sep | Oct | Nov | Dec |
|---|---|---|---|---|---|---|---|---|---|---|---|---|
| 1994 | - | - | - | - | - | - | - | - | - | - | - | W |
| 1995 | 0.839 | 0.819 | 0.791 | 0.830 | 0.890 | 0.867 | 0.830 | 0.817 | 0.792 | 0.733 | 0.718 | 0.740 |
| 1996 | 0.777 | 0.776 | 0.831 | 0.945 | 0.962 | 0.917 | 0.910 | 0.915 | 0.899 | 0.920 | 0.954 | 0.947 |
| 1997 | 0.960 | 0.944 | 0.912 | 0.893 | 0.880 | 0.860 | 0.870 | 0.925 | 0.914 | 0.878 | 0.852 | 0.830 |
| 1998 | 0.809 | 0.763 | 0.741 | 0.755 | 0.766 | 0.756 | 0.737 | 0.736 | 0.725 | 0.722 | 0.682 | 0.645 |
| 1999 | 0.635 | 0.614 | 0.687 | 0.759 | 0.783 | 0.783 | 0.834 | 0.877 | 0.945 | 0.941 | 0.977 | 0.981 |
| 2000 | 0.996 | 1.071 | 1.203 | 1.185 | 1.184 | 1.198 | 1.259 | 1.221 | 1.242 | 1.206 | 1.229 | NA |
| 2001 | 1.133 | NA | 1.215 | 1.335 | 1.436 | 1.317 | 1.234 | 1.184 | 1.184 | 1.031 | 0.942 | 0.841 |
| 2002 | 0.850 | 0.831 | 1.002 | 1.111 | 1.088 | NA | 1.070 | 1.079 | 1.063 | 1.107 | 1.124 | NA |
| 2003 | 1.167 | 1.323 | NA | NA | 1.133 | 1.181 | 1.220 | 1.352 | 1.293 | 1.249 | 1.197 | NA |
| 2004 | 1.303 | 1.394 | 1.410 | 1.455 | 1.743 | 1.607 | NA | 1.630 | 1.651 | 1.785 | 1.717 | 1.412 |
| 2005 | 1.568 | NA | 1.744 | 1.846 | 1.761 | 1.847 | 1.983 | 2.241 | 2.568 | 2.321 | 1.907 | 1.932 |
| 2006 | 2.067 | 1.897 | 2.221 | 2.603 | 2.721 | 2.749 | 2.867 | NA | 2.108 | 1.924 | 1.997 | 2.070 |
| 2007 | W | W | W | W | W | W | W | W | W | W | W | W |
| 2008 | W | W | W | W | W | W | W | W | W | W | W | NA |
| 2009 | NA | NA | NA | NA | NA | NA | NA | NA | NA | NA | NA | W |
| 2010 | W | 2.466 | 2.563 | 2.666 | 2.600 | 2.568 | 2.511 | 2.504 | 2.487 | 2.628 | 2.731 | 2.822 |
| 2011 | 2.929 | 3.002 | - | - | - | - | - | - | - | - | - | - |
| 2012 | - | - | - | - | - | - | - | - | - | - | - | - |
| 2013 | - | - | - | - | - | - | - | - | - | - | - | - |
| 2014 | - | - | - | - | - | - | - | - | - | - | - | - |
| 2015 | - | - | - | - | - | - | - | - | - | - | - | - |
| 2016 | - | - | - | - | - | - | - | - | - | - | - | - |
| 2017 | - | - | - | - | - | - | - | - | - | - | - | - |
| 2018 | - | - | - | - | - | - | - | - | - | - | - | - |
| 2019 | - | - | - | - | - | - | - | - | - | - | - | - |
| 2020 | - | - | - | - | - | - | - | - | - | - | - | - |
| 2021 | - | - | - | - | - | - | - | - | - | - | - | - |
| 2022 | - | - | - | |||||||||
| - = No Data Reported; -- = Not Applicable; NA = Not Available; W = Withheld to avoid disclosure of individual company data. |
| Release Date: 6/1/2022 |
| Next Release Date: TBD |