|
Download Data (XLS File) |
|
||||||||
|
||||||||
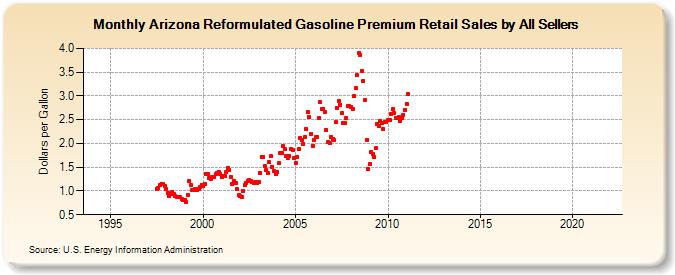
| Arizona Reformulated Gasoline Premium Retail Sales by All Sellers (Dollars per Gallon) | ||||||||
| Year | Jan | Feb | Mar | Apr | May | Jun | Jul | Aug | Sep | Oct | Nov | Dec |
|---|---|---|---|---|---|---|---|---|---|---|---|---|
| 1994 | - | - | - | - | - | - | - | - | - | - | - | - |
| 1995 | - | - | - | - | - | - | - | - | - | - | - | - |
| 1996 | - | - | - | - | - | - | - | - | - | - | - | - |
| 1997 | - | - | - | - | - | W | 1.031 | 1.061 | 1.132 | 1.155 | 1.143 | 1.101 |
| 1998 | 1.051 | 0.966 | 0.895 | 0.929 | 0.986 | 0.946 | 0.901 | 0.879 | 0.870 | 0.871 | 0.834 | 0.805 |
| 1999 | 0.815 | 0.772 | 0.906 | 1.205 | 1.128 | 1.017 | 1.029 | 1.046 | 1.028 | 1.046 | 1.079 | 1.132 |
| 2000 | 1.113 | 1.155 | 1.360 | 1.362 | 1.281 | 1.254 | 1.290 | 1.299 | 1.357 | 1.388 | 1.407 | 1.353 |
| 2001 | 1.303 | 1.307 | 1.315 | 1.391 | 1.491 | 1.450 | 1.301 | 1.156 | 1.213 | 1.157 | 1.042 | 0.905 |
| 2002 | 0.892 | 0.882 | 1.001 | 1.116 | 1.168 | 1.213 | 1.228 | 1.201 | 1.188 | 1.174 | 1.197 | 1.168 |
| 2003 | 1.194 | 1.386 | 1.717 | 1.715 | 1.524 | 1.437 | 1.385 | 1.601 | 1.730 | 1.509 | 1.412 | 1.354 |
| 2004 | 1.404 | 1.582 | 1.789 | 1.793 | 1.940 | 1.876 | 1.744 | 1.696 | 1.739 | 1.879 | 1.868 | 1.688 |
| 2005 | 1.581 | 1.718 | 1.875 | 2.121 | 2.075 | 1.994 | 2.125 | 2.306 | 2.667 | 2.551 | 2.206 | 1.956 |
| 2006 | 2.069 | 2.128 | 2.142 | 2.532 | 2.868 | 2.727 | 2.720 | 2.656 | 2.287 | 2.022 | 2.007 | 2.131 |
| 2007 | 2.102 | 2.071 | 2.449 | 2.745 | 2.901 | 2.817 | 2.635 | 2.435 | 2.431 | 2.538 | 2.785 | 2.786 |
| 2008 | 2.763 | 2.716 | 2.993 | 3.158 | 3.431 | 3.906 | 3.859 | 3.531 | 3.319 | 2.904 | 2.076 | 1.466 |
| 2009 | 1.577 | 1.816 | 1.775 | 1.710 | 1.901 | 2.416 | 2.361 | 2.473 | 2.424 | 2.296 | 2.452 | 2.448 |
| 2010 | 2.495 | 2.487 | 2.619 | 2.723 | 2.641 | 2.540 | 2.532 | 2.548 | 2.479 | 2.529 | 2.602 | 2.711 |
| 2011 | 2.837 | 3.030 | - | - | - | - | - | - | - | - | - | - |
| 2012 | - | - | - | - | - | - | - | - | - | - | - | - |
| 2013 | - | - | - | - | - | - | - | - | - | - | - | - |
| 2014 | - | - | - | - | - | - | - | - | - | - | - | - |
| 2015 | - | - | - | - | - | - | - | - | - | - | - | - |
| 2016 | - | - | - | - | - | - | - | - | - | - | - | - |
| 2017 | - | - | - | - | - | - | - | - | - | - | - | - |
| 2018 | - | - | - | - | - | - | - | - | - | - | - | - |
| 2019 | - | - | - | - | - | - | - | - | - | - | - | - |
| 2020 | - | - | - | - | - | - | - | - | - | - | - | - |
| 2021 | - | - | - | - | - | - | - | - | - | - | - | - |
| 2022 | - | - | - | |||||||||
| - = No Data Reported; -- = Not Applicable; NA = Not Available; W = Withheld to avoid disclosure of individual company data. |
| Release Date: 6/1/2022 |
| Next Release Date: TBD |