|
Download Data (XLS File) |
|
||||||||
|
||||||||
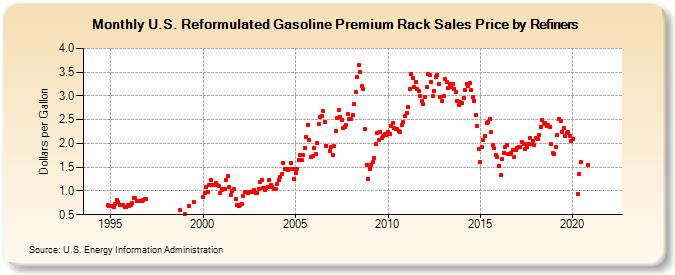
| U.S. Reformulated Gasoline Premium Rack Sales Price by Refiners (Dollars per Gallon) | ||||||||
| Year | Jan | Feb | Mar | Apr | May | Jun | Jul | Aug | Sep | Oct | Nov | Dec |
|---|---|---|---|---|---|---|---|---|---|---|---|---|
| 1994 | - | - | - | - | - | - | - | - | - | - | 0.695 | 0.675 |
| 1995 | 0.686 | 0.689 | 0.666 | 0.732 | 0.804 | 0.766 | 0.699 | 0.695 | 0.706 | 0.654 | 0.653 | 0.695 |
| 1996 | 0.693 | 0.694 | 0.751 | 0.859 | 0.860 | 0.791 | 0.798 | 0.785 | 0.793 | 0.806 | 0.826 | 0.829 |
| 1997 | W | W | W | W | W | W | W | W | W | W | W | W |
| 1998 | W | W | W | W | W | W | W | W | W | 0.599 | W | W |
| 1999 | 0.505 | W | W | 0.693 | W | W | 0.777 | W | W | W | W | W |
| 2000 | 0.864 | 0.957 | 1.078 | 0.975 | 1.116 | 1.224 | 1.127 | 1.122 | 1.169 | 1.121 | 1.102 | 0.950 |
| 2001 | 1.025 | 1.038 | 1.031 | 1.232 | 1.307 | 1.088 | 0.909 | 1.007 | 1.034 | 0.826 | 0.710 | 0.676 |
| 2002 | 0.708 | 0.728 | 0.890 | 0.979 | 0.969 | 0.961 | 0.981 | 0.980 | 0.988 | 1.024 | 0.954 | 0.957 |
| 2003 | 1.043 | 1.191 | 1.222 | 1.066 | 1.021 | 1.072 | 1.080 | 1.226 | 1.131 | 1.083 | 1.045 | 1.039 |
| 2004 | 1.145 | 1.237 | 1.301 | 1.361 | 1.581 | 1.460 | 1.472 | 1.448 | 1.457 | 1.587 | 1.470 | 1.261 |
| 2005 | 1.382 | 1.452 | 1.651 | 1.763 | 1.643 | 1.750 | 1.899 | 2.141 | 2.395 | 2.067 | 1.714 | 1.740 |
| 2006 | 1.907 | 1.773 | 2.013 | 2.413 | 2.551 | 2.578 | 2.684 | 2.459 | 1.953 | W | 1.837 | 1.915 |
| 2007 | 1.763 | 1.940 | 2.257 | 2.531 | 2.707 | 2.552 | 2.503 | 2.323 | 2.348 | 2.386 | 2.609 | 2.512 |
| 2008 | 2.520 | 2.588 | 2.834 | 3.080 | 3.390 | 3.641 | 3.502 | 3.215 | 3.143 | 2.296 | 1.552 | 1.249 |
| 2009 | 1.460 | 1.552 | 1.601 | 1.693 | 1.978 | 2.222 | 2.068 | 2.247 | 2.106 | 2.161 | 2.193 | 2.177 |
| 2010 | 2.249 | 2.193 | 2.366 | 2.439 | 2.315 | 2.311 | 2.301 | 2.266 | 2.244 | 2.382 | 2.442 | 2.572 |
| 2011 | 2.639 | 2.775 | 3.142 | 3.468 | 3.387 | 3.196 | 3.284 | 3.144 | 3.093 | 2.994 | 2.895 | 2.821 |
| 2012 | 2.987 | 3.190 | 3.462 | 3.444 | 3.295 | 2.990 | 3.105 | 3.394 | 3.446 | 3.251 | 2.981 | 2.884 |
| 2013 | 3.003 | 3.354 | 3.283 | 3.161 | 3.254 | 3.188 | 3.253 | 3.153 | 3.072 | 2.888 | 2.809 | 2.879 |
| 2014 | 2.851 | 2.960 | 3.130 | 3.261 | 3.210 | 3.280 | 3.124 | 2.986 | 2.901 | 2.591 | 2.369 | 1.889 |
| 2015 | 1.615 | 1.922 | 2.076 | 2.162 | 2.429 | 2.450 | 2.505 | 2.232 | 1.972 | 1.895 | 1.765 | 1.725 |
| 2016 | 1.524 | 1.333 | 1.668 | 1.804 | 1.915 | 1.957 | 1.788 | 1.772 | 1.797 | 1.857 | 1.723 | 1.864 |
| 2017 | 1.908 | 1.922 | 1.928 | 2.031 | 1.985 | 1.876 | 1.930 | 1.998 | 2.116 | 1.980 | 2.048 | 1.958 |
| 2018 | 2.106 | 2.088 | 2.185 | 2.350 | 2.500 | 2.412 | 2.426 | 2.362 | 2.393 | 2.352 | 1.980 | 1.798 |
| 2019 | 1.780 | 1.930 | 2.186 | 2.511 | 2.481 | 2.249 | 2.329 | 2.146 | 2.211 | 2.248 | 2.152 | 2.056 |
| 2020 | 2.085 | W | W | 0.944 | 1.367 | 1.601 | W | W | W | W | 1.549 | W |
| 2021 | W | W | W | W | W | W | W | W | W | W | W | W |
| 2022 | W | W | W | |||||||||
| - = No Data Reported; -- = Not Applicable; NA = Not Available; W = Withheld to avoid disclosure of individual company data. |
| Release Date: 6/1/2022 |
| Next Release Date: TBD |