|
Download Data (XLS File) |
|
||||||||
|
||||||||
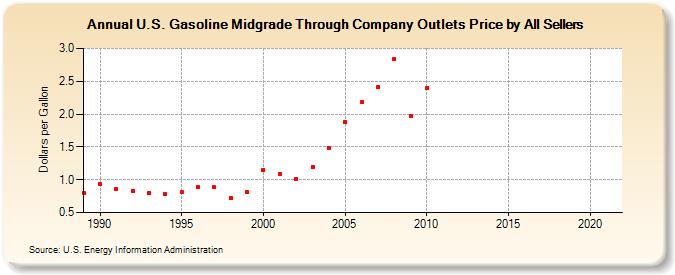
| U.S. Gasoline Midgrade Through Company Outlets Price by All Sellers (Dollars per Gallon) | ||||||||
| Decade | Year-0 | Year-1 | Year-2 | Year-3 | Year-4 | Year-5 | Year-6 | Year-7 | Year-8 | Year-9 |
|---|---|---|---|---|---|---|---|---|---|---|
| 1980's | 0.802 | |||||||||
| 1990's | 0.936 | 0.856 | 0.830 | 0.799 | 0.777 | 0.807 | 0.890 | 0.885 | 0.716 | 0.816 |
| 2000's | 1.150 | 1.090 | 1.005 | 1.201 | 1.486 | 1.880 | 2.183 | 2.414 | 2.845 | 1.971 |
| 2010's | 2.394 | - | - | - | - | - | - | - | - | - |
| 2020's | - |
| - = No Data Reported; -- = Not Applicable; NA = Not Available; W = Withheld to avoid disclosure of individual company data. |
| Release Date: 6/1/2022 |
| Next Release Date: TBD |