|
Download Data (XLS File) |
|
||||||||
|
||||||||
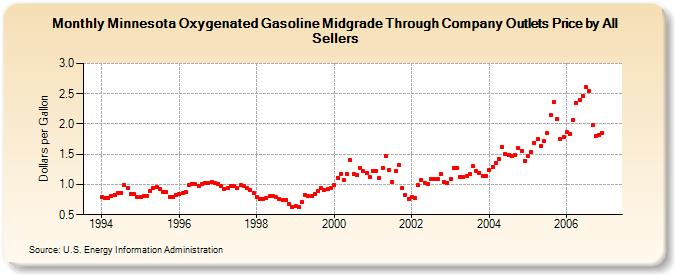
| Minnesota Oxygenated Gasoline Midgrade Through Company Outlets Price by All Sellers (Dollars per Gallon) | ||||||||
| Year | Jan | Feb | Mar | Apr | May | Jun | Jul | Aug | Sep | Oct | Nov | Dec |
|---|---|---|---|---|---|---|---|---|---|---|---|---|
| 1994 | 0.797 | 0.784 | 0.776 | 0.817 | 0.827 | 0.851 | 0.866 | 0.983 | 0.940 | 0.848 | 0.842 | 0.785 |
| 1995 | 0.787 | 0.803 | 0.814 | 0.893 | 0.939 | 0.962 | 0.924 | 0.879 | 0.873 | 0.800 | 0.801 | 0.819 |
| 1996 | 0.841 | 0.851 | 0.882 | 0.983 | 1.012 | 1.002 | 0.978 | 1.002 | 1.031 | 1.027 | 1.036 | 1.028 |
| 1997 | 1.014 | 0.979 | 0.932 | 0.938 | 0.970 | 0.968 | 0.937 | 0.984 | 0.978 | 0.934 | 0.911 | 0.858 |
| 1998 | 0.793 | 0.768 | 0.767 | 0.776 | 0.807 | 0.806 | 0.785 | 0.752 | 0.744 | 0.740 | 0.672 | 0.624 |
| 1999 | 0.640 | 0.629 | 0.707 | 0.826 | 0.812 | 0.805 | 0.841 | 0.895 | 0.947 | 0.913 | 0.931 | 0.943 |
| 2000 | 0.983 | 1.112 | 1.170 | 1.067 | 1.172 | 1.399 | 1.176 | 1.162 | 1.266 | 1.216 | 1.185 | 1.123 |
| 2001 | 1.226 | 1.218 | 1.110 | 1.268 | 1.475 | 1.245 | 1.049 | 1.228 | 1.317 | 0.940 | 0.833 | 0.756 |
| 2002 | 0.788 | 0.776 | 0.992 | 1.071 | 1.026 | 1.015 | 1.091 | 1.096 | 1.091 | 1.175 | 1.045 | 1.026 |
| 2003 | 1.098 | 1.275 | 1.265 | 1.120 | 1.123 | 1.146 | 1.174 | 1.301 | 1.219 | 1.196 | 1.140 | 1.133 |
| 2004 | 1.231 | 1.289 | 1.358 | 1.426 | 1.625 | 1.506 | 1.489 | 1.468 | 1.482 | 1.600 | 1.556 | 1.396 |
| 2005 | 1.467 | 1.533 | 1.693 | 1.744 | 1.636 | 1.723 | 1.847 | 2.146 | 2.364 | 2.081 | 1.752 | 1.782 |
| 2006 | 1.863 | 1.834 | 2.073 | 2.345 | 2.397 | 2.467 | 2.607 | 2.551 | 1.980 | 1.801 | 1.822 | 1.852 |
| - = No Data Reported; -- = Not Applicable; NA = Not Available; W = Withheld to avoid disclosure of individual company data. |
| Release Date: 6/1/2022 |
| Next Release Date: TBD |