|
Download Data (XLS File) |
|
||||||||
|
||||||||
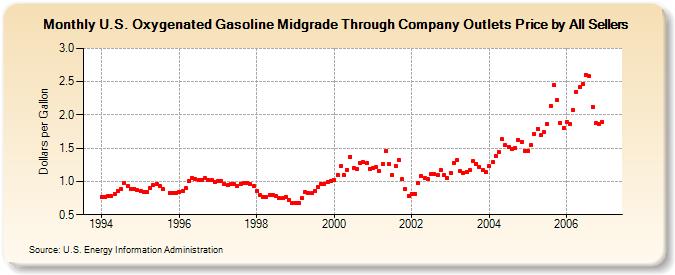
| U.S. Oxygenated Gasoline Midgrade Through Company Outlets Price by All Sellers (Dollars per Gallon) | ||||||||
| Year | Jan | Feb | Mar | Apr | May | Jun | Jul | Aug | Sep | Oct | Nov | Dec |
|---|---|---|---|---|---|---|---|---|---|---|---|---|
| 1994 | 0.770 | 0.769 | 0.784 | 0.776 | 0.816 | 0.858 | 0.884 | 0.980 | 0.929 | 0.884 | 0.892 | 0.865 |
| 1995 | 0.851 | 0.846 | 0.841 | 0.897 | 0.943 | 0.964 | 0.925 | 0.879 | NA | 0.829 | 0.832 | 0.826 |
| 1996 | 0.842 | 0.856 | 0.897 | 1.006 | 1.054 | 1.037 | 1.015 | 1.022 | 1.047 | 1.026 | 1.020 | 0.995 |
| 1997 | 1.002 | 1.011 | 0.968 | 0.940 | 0.958 | 0.955 | 0.930 | 0.966 | 0.979 | 0.973 | 0.961 | 0.926 |
| 1998 | 0.859 | 0.794 | 0.760 | 0.761 | 0.798 | 0.800 | 0.781 | 0.750 | 0.744 | 0.765 | 0.722 | 0.681 |
| 1999 | 0.681 | 0.671 | 0.747 | 0.845 | 0.830 | 0.819 | 0.858 | 0.913 | 0.961 | 0.967 | 0.992 | 1.008 |
| 2000 | 1.019 | 1.101 | 1.228 | 1.100 | 1.178 | 1.375 | 1.201 | 1.181 | 1.278 | 1.285 | 1.270 | 1.193 |
| 2001 | 1.202 | 1.210 | 1.159 | 1.264 | 1.453 | 1.263 | 1.091 | 1.236 | 1.324 | 1.030 | 0.890 | 0.785 |
| 2002 | 0.818 | 0.815 | 0.983 | 1.078 | 1.049 | 1.035 | 1.106 | 1.112 | 1.098 | 1.168 | 1.095 | 1.053 |
| 2003 | 1.128 | 1.284 | 1.315 | 1.159 | 1.134 | 1.149 | 1.165 | 1.300 | 1.263 | 1.223 | 1.170 | 1.140 |
| 2004 | 1.226 | 1.288 | 1.384 | 1.444 | 1.632 | 1.543 | 1.516 | 1.494 | 1.502 | 1.624 | 1.600 | 1.464 |
| 2005 | 1.463 | 1.543 | 1.715 | 1.794 | 1.694 | 1.736 | 1.866 | 2.140 | 2.444 | 2.221 | 1.883 | 1.801 |
| 2006 | 1.891 | 1.859 | 2.067 | 2.350 | 2.419 | 2.470 | 2.607 | 2.578 | 2.124 | 1.876 | 1.868 | 1.901 |
| - = No Data Reported; -- = Not Applicable; NA = Not Available; W = Withheld to avoid disclosure of individual company data. |
| Release Date: 6/1/2022 |
| Next Release Date: TBD |