|
Download Data (XLS File) |
|
||||||||
|
||||||||
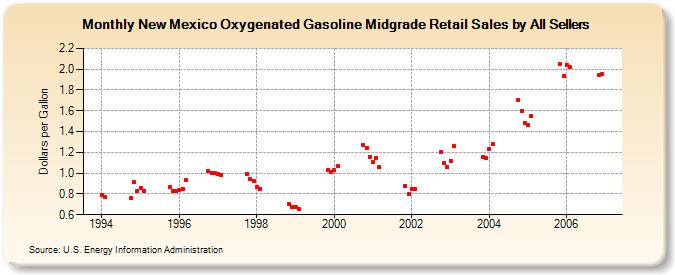
| New Mexico Oxygenated Gasoline Midgrade Retail Sales by All Sellers (Dollars per Gallon) | ||||||||
| Year | Jan | Feb | Mar | Apr | May | Jun | Jul | Aug | Sep | Oct | Nov | Dec |
|---|---|---|---|---|---|---|---|---|---|---|---|---|
| 1994 | 0.792 | 0.766 | - | - | - | - | - | - | - | 0.759 | 0.913 | 0.826 |
| 1995 | 0.859 | 0.831 | W | W | W | W | W | W | W | 0.866 | 0.824 | 0.828 |
| 1996 | 0.838 | 0.847 | 0.931 | W | W | W | W | W | W | 1.024 | 1.006 | 0.997 |
| 1997 | 0.996 | 0.986 | W | NA | W | W | W | W | W | 0.996 | 0.946 | 0.929 |
| 1998 | 0.866 | 0.846 | W | W | NA | W | W | - | - | W | 0.700 | 0.675 |
| 1999 | 0.672 | 0.653 | W | W | W | W | NA | NA | W | W | 1.029 | 1.014 |
| 2000 | 1.027 | 1.064 | W | W | W | W | W | W | W | 1.273 | 1.243 | 1.156 |
| 2001 | 1.109 | 1.146 | 1.060 | W | W | W | W | W | W | W | 0.876 | 0.799 |
| 2002 | 0.851 | 0.845 | W | W | W | W | W | W | W | 1.203 | 1.094 | 1.057 |
| 2003 | 1.118 | 1.259 | W | W | W | W | W | W | W | W | 1.154 | 1.141 |
| 2004 | 1.230 | 1.276 | W | W | W | W | W | W | W | 1.708 | 1.599 | 1.481 |
| 2005 | 1.459 | 1.552 | W | W | W | W | W | W | W | W | 2.048 | 1.934 |
| 2006 | 2.041 | 2.018 | W | W | W | W | W | W | W | W | 1.940 | 1.958 |
| - = No Data Reported; -- = Not Applicable; NA = Not Available; W = Withheld to avoid disclosure of individual company data. |
| Release Date: 6/1/2022 |
| Next Release Date: TBD |