|
Download Data (XLS File) |
|
||||||||
|
||||||||
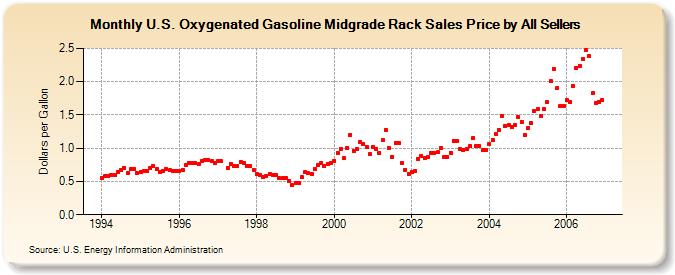
| U.S. Oxygenated Gasoline Midgrade Rack Sales Price by All Sellers (Dollars per Gallon) | ||||||||
| Year | Jan | Feb | Mar | Apr | May | Jun | Jul | Aug | Sep | Oct | Nov | Dec |
|---|---|---|---|---|---|---|---|---|---|---|---|---|
| 1994 | 0.556 | 0.578 | 0.586 | 0.597 | 0.594 | 0.644 | 0.673 | 0.708 | 0.629 | 0.687 | 0.694 | 0.625 |
| 1995 | 0.643 | 0.655 | 0.661 | 0.697 | 0.735 | 0.687 | 0.639 | 0.653 | 0.689 | 0.668 | 0.655 | 0.658 |
| 1996 | 0.650 | 0.676 | 0.744 | 0.776 | 0.775 | 0.775 | 0.762 | 0.800 | 0.820 | 0.822 | 0.805 | 0.784 |
| 1997 | 0.802 | 0.802 | NA | 0.707 | 0.769 | 0.729 | 0.728 | 0.792 | 0.777 | 0.739 | 0.727 | 0.673 |
| 1998 | 0.608 | 0.598 | 0.572 | 0.584 | 0.615 | 0.604 | 0.596 | 0.547 | 0.553 | 0.559 | 0.507 | 0.447 |
| 1999 | 0.477 | 0.476 | 0.562 | 0.636 | 0.623 | 0.618 | 0.687 | 0.741 | 0.774 | 0.727 | 0.766 | 0.776 |
| 2000 | 0.813 | 0.930 | 0.992 | 0.847 | 1.000 | 1.195 | 0.963 | 0.989 | 1.093 | 1.060 | 1.025 | 0.912 |
| 2001 | 1.022 | 0.992 | 0.931 | 1.122 | 1.278 | 0.998 | 0.872 | 1.077 | 1.081 | 0.784 | 0.678 | 0.618 |
| 2002 | 0.648 | 0.654 | 0.837 | 0.888 | 0.858 | 0.860 | 0.935 | 0.931 | 0.938 | 1.002 | 0.866 | 0.875 |
| 2003 | 0.935 | 1.111 | 1.107 | 0.988 | 0.977 | 0.984 | 1.029 | 1.150 | 1.027 | 1.032 | 0.970 | 0.975 |
| 2004 | 1.064 | 1.125 | 1.208 | 1.279 | 1.480 | 1.332 | 1.349 | 1.312 | 1.341 | 1.467 | 1.398 | 1.205 |
| 2005 | 1.307 | 1.377 | 1.558 | 1.585 | 1.489 | 1.593 | 1.687 | 2.009 | 2.188 | 1.904 | 1.635 | 1.641 |
| 2006 | 1.718 | 1.692 | 1.931 | 2.209 | 2.239 | 2.342 | 2.471 | 2.382 | 1.823 | 1.678 | 1.696 | 1.721 |
| - = No Data Reported; -- = Not Applicable; NA = Not Available; W = Withheld to avoid disclosure of individual company data. |
| Release Date: 6/1/2022 |
| Next Release Date: TBD |