|
Download Data (XLS File) |
|
||||||||
|
||||||||
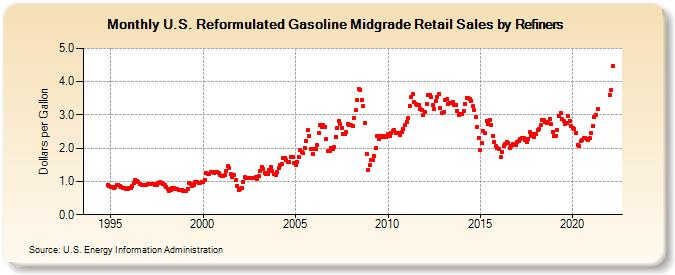
| U.S. Reformulated Gasoline Midgrade Retail Sales by Refiners (Dollars per Gallon) | ||||||||
| Year | Jan | Feb | Mar | Apr | May | Jun | Jul | Aug | Sep | Oct | Nov | Dec |
|---|---|---|---|---|---|---|---|---|---|---|---|---|
| 1994 | - | - | - | - | - | - | - | - | - | - | 0.895 | 0.872 |
| 1995 | 0.848 | 0.831 | 0.817 | 0.837 | 0.888 | 0.900 | 0.873 | 0.831 | 0.802 | 0.800 | 0.784 | 0.787 |
| 1996 | 0.806 | 0.810 | 0.857 | 0.962 | 1.047 | 1.024 | 0.983 | 0.937 | 0.908 | 0.899 | 0.894 | 0.895 |
| 1997 | 0.918 | 0.924 | 0.917 | 0.924 | 0.922 | 0.907 | 0.892 | 0.947 | 0.979 | 0.958 | 0.925 | 0.891 |
| 1998 | 0.828 | 0.777 | 0.727 | 0.753 | 0.805 | 0.797 | 0.783 | 0.767 | 0.752 | 0.753 | 0.744 | 0.723 |
| 1999 | 0.715 | 0.698 | 0.778 | 0.943 | 0.930 | 0.872 | 0.906 | 0.980 | 0.978 | 0.962 | 0.962 | 0.989 |
| 2000 | 0.996 | 1.055 | 1.246 | 1.238 | 1.211 | 1.276 | 1.286 | 1.239 | 1.297 | 1.281 | 1.261 | 1.197 |
| 2001 | 1.167 | 1.174 | 1.180 | 1.301 | 1.450 | 1.400 | 1.229 | 1.135 | 1.182 | 1.031 | 0.877 | 0.756 |
| 2002 | 0.773 | 0.811 | 0.973 | 1.120 | 1.114 | 1.113 | 1.111 | 1.117 | 1.111 | 1.115 | 1.121 | 1.088 |
| 2003 | 1.169 | 1.326 | 1.449 | 1.369 | 1.259 | 1.223 | 1.223 | 1.350 | 1.431 | 1.300 | 1.231 | 1.191 |
| 2004 | 1.278 | 1.391 | 1.487 | 1.530 | 1.701 | 1.710 | 1.631 | 1.581 | 1.578 | 1.739 | 1.722 | 1.564 |
| 2005 | 1.495 | 1.581 | 1.746 | 1.946 | 1.882 | 1.846 | 2.006 | 2.215 | 2.538 | 2.375 | 1.966 | 1.820 |
| 2006 | 1.971 | 1.965 | 2.088 | 2.450 | 2.687 | 2.645 | 2.711 | 2.647 | 2.274 | 1.929 | 1.912 | 2.013 |
| 2007 | 1.972 | 2.024 | 2.349 | 2.599 | 2.816 | 2.720 | 2.615 | 2.432 | 2.425 | 2.477 | 2.738 | 2.701 |
| 2008 | 2.695 | 2.671 | 2.917 | 3.140 | 3.441 | 3.792 | 3.759 | 3.458 | 3.267 | 2.762 | 1.832 | 1.349 |
| 2009 | 1.481 | 1.632 | 1.638 | 1.768 | 1.995 | 2.356 | 2.283 | 2.378 | 2.366 | 2.326 | 2.359 | 2.325 |
| 2010 | 2.421 | 2.358 | 2.463 | 2.520 | 2.539 | 2.462 | 2.462 | 2.464 | 2.384 | 2.493 | 2.565 | 2.696 |
| 2011 | 2.788 | 2.898 | 3.272 | 3.529 | 3.618 | 3.388 | 3.332 | 3.297 | 3.310 | 3.188 | 3.139 | 2.994 |
| 2012 | 3.097 | 3.315 | 3.605 | 3.597 | 3.547 | 3.287 | 3.164 | 3.428 | 3.537 | 3.629 | 3.194 | 3.048 |
| 2013 | 3.085 | 3.453 | 3.466 | 3.317 | 3.356 | 3.365 | 3.383 | 3.288 | 3.305 | 3.131 | 2.985 | 3.014 |
| 2014 | 3.034 | 3.126 | 3.343 | 3.517 | 3.514 | 3.477 | 3.431 | 3.257 | 3.155 | 2.925 | 2.622 | 2.309 |
| 2015 | 1.958 | 2.142 | 2.503 | 2.450 | 2.826 | 2.736 | 2.862 | 2.701 | 2.358 | 2.181 | 2.057 | 2.011 |
| 2016 | 1.981 | 1.721 | 1.881 | 2.064 | 2.135 | 2.195 | 2.152 | 2.018 | 2.076 | 2.112 | 2.093 | 2.098 |
| 2017 | 2.194 | 2.225 | 2.274 | 2.303 | 2.309 | 2.260 | 2.193 | 2.276 | 2.473 | 2.352 | 2.438 | 2.345 |
| 2018 | 2.437 | 2.534 | 2.572 | 2.684 | 2.849 | 2.840 | 2.781 | 2.764 | 2.791 | 2.873 | 2.713 | 2.496 |
| 2019 | 2.355 | 2.380 | 2.538 | 2.979 | 3.059 | 2.871 | 2.807 | 2.732 | 2.748 | 2.955 | 2.822 | 2.652 |
| 2020 | 2.616 | 2.569 | 2.466 | 2.102 | 2.060 | 2.207 | 2.254 | 2.295 | 2.299 | 2.284 | 2.255 | 2.297 |
| 2021 | 2.451 | 2.672 | 2.930 | 3.006 | 3.166 | W | W | W | W | W | W | W |
| 2022 | 3.607 | 3.735 | 4.481 | |||||||||
| - = No Data Reported; -- = Not Applicable; NA = Not Available; W = Withheld to avoid disclosure of individual company data. |
| Release Date: 6/1/2022 |
| Next Release Date: TBD |