|
Download Data (XLS File) |
|
||||||||
|
||||||||
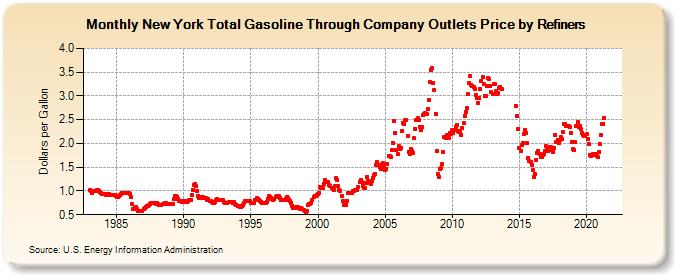
| New York Total Gasoline Through Company Outlets Price by Refiners (Dollars per Gallon) | ||||||||
| Year | Jan | Feb | Mar | Apr | May | Jun | Jul | Aug | Sep | Oct | Nov | Dec |
|---|---|---|---|---|---|---|---|---|---|---|---|---|
| 1983 | 1.028 | 0.990 | 0.958 | 0.998 | 0.997 | 1.000 | 1.024 | 1.017 | 0.995 | 0.968 | 0.960 | 0.946 |
| 1984 | 0.940 | 0.927 | 0.922 | 0.928 | 0.930 | 0.931 | 0.918 | 0.907 | 0.910 | 0.908 | 0.906 | 0.897 |
| 1985 | 0.872 | 0.865 | 0.886 | 0.919 | 0.928 | 0.949 | 0.960 | 0.961 | 0.952 | 0.949 | 0.948 | 0.948 |
| 1986 | 0.941 | 0.870 | 0.727 | 0.625 | 0.643 | 0.661 | 0.621 | 0.568 | 0.585 | 0.575 | 0.571 | 0.576 |
| 1987 | 0.616 | 0.645 | 0.658 | 0.673 | 0.680 | 0.704 | 0.725 | 0.748 | 0.750 | 0.744 | 0.744 | 0.732 |
| 1988 | 0.736 | 0.718 | 0.705 | 0.701 | 0.710 | 0.730 | 0.726 | 0.738 | 0.737 | 0.732 | 0.731 | 0.729 |
| 1989 | 0.734 | 0.732 | 0.732 | 0.825 | 0.888 | 0.896 | 0.869 | 0.821 | 0.798 | 0.793 | 0.776 | 0.780 |
| 1990 | 0.794 | 0.791 | 0.775 | 0.776 | 0.792 | 0.812 | 0.814 | 0.912 | 1.029 | 1.123 | 1.141 | 1.094 |
| 1991 | 0.991 | 0.897 | 0.850 | 0.856 | 0.879 | 0.876 | 0.856 | 0.849 | 0.850 | 0.820 | 0.830 | 0.797 |
| 1992 | 0.785 | 0.758 | 0.737 | 0.739 | 0.772 | 0.812 | 0.825 | 0.814 | 0.808 | 0.806 | 0.819 | 0.804 |
| 1993 | 0.776 | 0.757 | 0.741 | 0.741 | 0.760 | 0.763 | 0.762 | 0.760 | 0.749 | 0.758 | 0.731 | 0.705 |
| 1994 | 0.682 | 0.678 | 0.667 | 0.668 | 0.679 | 0.703 | 0.741 | 0.786 | 0.789 | 0.788 | 0.783 | 0.780 |
| 1995 | 0.757 | 0.747 | 0.737 | 0.753 | 0.812 | 0.844 | 0.839 | 0.810 | 0.799 | 0.778 | 0.750 | 0.749 |
| 1996 | 0.752 | 0.749 | 0.763 | 0.829 | 0.888 | 0.883 | 0.852 | 0.821 | 0.813 | 0.822 | 0.869 | 0.901 |
| 1997 | 0.902 | 0.884 | 0.846 | 0.819 | 0.808 | 0.817 | 0.802 | 0.838 | 0.882 | 0.847 | 0.820 | 0.789 |
| 1998 | 0.748 | 0.693 | 0.642 | 0.651 | 0.659 | 0.664 | 0.655 | 0.638 | 0.626 | 0.638 | 0.630 | 0.595 |
| 1999 | 0.574 | 0.547 | 0.575 | 0.694 | 0.724 | 0.715 | 0.747 | 0.816 | 0.868 | 0.896 | 0.888 | 0.915 |
| 2000 | 0.929 | 0.960 | 1.090 | 1.067 | 1.058 | 1.152 | 1.235 | 1.179 | 1.197 | 1.182 | 1.132 | 1.097 |
| 2001 | 1.057 | 1.050 | 1.015 | 1.107 | 1.264 | 1.233 | 1.102 | 1.021 | 1.005 | 0.895 | 0.785 | 0.701 |
| 2002 | 0.697 | 0.699 | 0.795 | 0.953 | 0.966 | 0.955 | 0.961 | 0.999 | 1.006 | 1.021 | 1.030 | 1.030 |
| 2003 | 1.075 | 1.183 | 1.230 | 1.182 | 1.111 | 1.055 | 1.070 | 1.172 | 1.293 | 1.219 | 1.172 | 1.153 |
| 2004 | 1.202 | 1.265 | 1.327 | 1.352 | 1.537 | 1.610 | 1.542 | 1.494 | 1.472 | 1.568 | 1.579 | 1.505 |
| 2005 | 1.434 | 1.464 | 1.560 | 1.729 | 1.728 | 1.717 | 1.852 | 2.008 | 2.465 | 2.219 | 1.867 | 1.775 |
| 2006 | 1.936 | 1.882 | 1.910 | 2.265 | 2.431 | 2.409 | 2.489 | 2.488 | 2.154 | 1.823 | 1.772 | 1.879 |
| 2007 | 1.845 | 1.797 | 2.105 | 2.314 | 2.498 | 2.528 | 2.487 | 2.354 | 2.288 | 2.344 | 2.589 | 2.629 |
| 2008 | 2.643 | 2.609 | 2.724 | 2.909 | 3.289 | 3.553 | 3.577 | 3.281 | 3.116 | 2.625 | 1.844 | 1.357 |
| 2009 | 1.303 | 1.467 | 1.491 | 1.575 | 1.813 | 2.145 | 2.121 | 2.176 | 2.154 | 2.115 | 2.224 | 2.200 |
| 2010 | 2.278 | 2.223 | 2.282 | 2.355 | 2.395 | 2.260 | 2.235 | 2.236 | 2.172 | 2.318 | 2.438 | 2.586 |
| 2011 | 2.668 | 2.738 | 3.045 | 3.282 | 3.413 | 3.230 | 3.207 | 3.196 | 3.154 | 3.019 | 2.962 | 2.861 |
| 2012 | 2.956 | 3.142 | 3.305 | 3.399 | 3.249 | 3.006 | 2.996 | 3.200 | 3.370 | 3.350 | 3.202 | 3.087 |
| 2013 | 3.046 | 3.255 | 3.253 | 3.105 | 3.043 | 3.062 | 3.158 | 3.182 | 3.135 | NA | NA | W |
| 2014 | W | W | W | W | W | W | W | W | W | 2.798 | 2.576 | 2.303 |
| 2015 | 1.895 | 1.841 | 1.970 | 2.014 | 2.202 | 2.289 | 2.228 | 2.014 | 1.701 | 1.622 | 1.610 | 1.540 |
| 2016 | 1.435 | 1.293 | 1.350 | 1.657 | 1.803 | 1.840 | 1.780 | 1.708 | 1.715 | 1.764 | 1.781 | 1.836 |
| 2017 | 1.937 | 1.872 | 1.832 | 1.919 | 1.920 | 1.872 | 1.829 | 1.897 | 2.183 | 2.034 | 2.067 | 2.004 |
| 2018 | 2.082 | 2.129 | 2.086 | 2.239 | 2.415 | 2.406 | 2.374 | 2.361 | 2.358 | 2.353 | 2.219 | 2.034 |
| 2019 | 1.878 | 1.859 | 2.026 | 2.359 | 2.446 | 2.342 | 2.362 | 2.297 | 2.226 | 2.180 | 2.165 | 2.164 |
| 2020 | 2.192 | 2.085 | 1.979 | 1.761 | 1.735 | 1.759 | 1.768 | 1.763 | 1.788 | 1.746 | 1.716 | 1.815 |
| 2021 | 1.983 | 2.178 | 2.409 | 2.418 | 2.545 | W | W | W | W | W | W | W |
| 2022 | W | W | W | |||||||||
| - = No Data Reported; -- = Not Applicable; NA = Not Available; W = Withheld to avoid disclosure of individual company data. |
| Release Date: 6/1/2022 |
| Next Release Date: TBD |