|
Download Data (XLS File) |
|
||||||||
|
||||||||
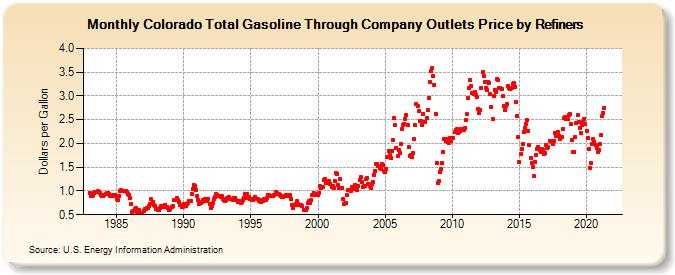
| Colorado Total Gasoline Through Company Outlets Price by Refiners (Dollars per Gallon) | ||||||||
| Year | Jan | Feb | Mar | Apr | May | Jun | Jul | Aug | Sep | Oct | Nov | Dec |
|---|---|---|---|---|---|---|---|---|---|---|---|---|
| 1983 | 0.954 | 0.903 | 0.885 | 0.922 | 0.966 | 0.988 | 0.973 | 0.993 | 0.974 | 0.959 | 0.924 | 0.904 |
| 1984 | 0.889 | 0.910 | 0.939 | 0.950 | 0.949 | 0.937 | 0.896 | 0.891 | 0.901 | 0.912 | 0.921 | 0.885 |
| 1985 | 0.825 | 0.810 | 0.902 | 1.008 | 1.014 | 1.000 | 0.991 | 0.994 | 0.990 | 0.972 | 0.937 | 0.916 |
| 1986 | 0.850 | 0.729 | 0.567 | 0.581 | 0.617 | 0.642 | 0.559 | 0.569 | 0.590 | 0.540 | 0.544 | 0.543 |
| 1987 | 0.584 | 0.624 | 0.611 | 0.632 | 0.650 | 0.690 | 0.725 | 0.824 | 0.774 | 0.705 | 0.678 | 0.617 |
| 1988 | 0.610 | 0.591 | 0.589 | 0.650 | 0.692 | 0.672 | 0.678 | 0.705 | 0.668 | 0.670 | 0.632 | 0.598 |
| 1989 | 0.621 | 0.652 | 0.684 | 0.807 | 0.811 | 0.820 | 0.859 | 0.800 | 0.761 | 0.702 | 0.658 | 0.665 |
| 1990 | 0.721 | 0.704 | 0.685 | 0.717 | 0.744 | 0.798 | 0.799 | 0.944 | 1.034 | 1.124 | 1.099 | 1.027 |
| 1991 | 0.900 | 0.800 | 0.721 | 0.741 | 0.765 | 0.807 | 0.783 | 0.829 | 0.834 | 0.792 | 0.836 | 0.731 |
| 1992 | 0.642 | 0.679 | 0.744 | 0.825 | 0.872 | 0.929 | 0.917 | 0.900 | 0.902 | 0.865 | 0.889 | 0.830 |
| 1993 | 0.802 | 0.799 | 0.809 | 0.850 | 0.875 | 0.841 | 0.824 | 0.824 | 0.818 | 0.848 | 0.860 | 0.806 |
| 1994 | 0.767 | 0.785 | 0.760 | 0.751 | 0.760 | 0.805 | 0.847 | 0.934 | 0.929 | 0.855 | 0.877 | 0.840 |
| 1995 | 0.825 | 0.804 | 0.806 | 0.822 | 0.872 | 0.838 | 0.822 | 0.796 | 0.806 | 0.758 | 0.784 | 0.784 |
| 1996 | 0.821 | 0.819 | 0.861 | 0.906 | 0.909 | 0.904 | 0.892 | 0.887 | 0.896 | 0.925 | 0.973 | 0.956 |
| 1997 | 0.944 | 0.934 | 0.910 | 0.898 | 0.867 | 0.874 | 0.885 | 0.913 | 0.904 | 0.902 | 0.915 | 0.909 |
| 1998 | 0.831 | 0.713 | 0.642 | 0.694 | 0.721 | 0.784 | 0.729 | 0.702 | 0.699 | 0.706 | 0.680 | 0.604 |
| 1999 | 0.604 | 0.595 | 0.645 | 0.742 | 0.788 | 0.757 | 0.800 | 0.925 | 0.962 | 0.943 | 0.918 | 0.924 |
| 2000 | 0.915 | 0.963 | 1.100 | 1.067 | 1.073 | 1.233 | 1.255 | 1.165 | 1.194 | 1.196 | 1.209 | 1.148 |
| 2001 | 1.089 | 1.102 | 1.059 | 1.211 | 1.369 | 1.354 | 1.131 | 1.066 | 1.245 | 1.067 | 0.823 | 0.717 |
| 2002 | 0.749 | 0.749 | 0.911 | 1.012 | 1.020 | 0.993 | 1.075 | 1.088 | 1.042 | 1.131 | 1.099 | 1.020 |
| 2003 | 1.108 | 1.224 | 1.284 | 1.179 | 1.092 | 1.098 | 1.103 | 1.251 | 1.275 | 1.153 | 1.108 | 1.060 |
| 2004 | 1.148 | 1.190 | 1.335 | 1.426 | 1.566 | 1.559 | 1.516 | 1.485 | 1.464 | 1.562 | 1.543 | 1.428 |
| 2005 | 1.395 | 1.468 | 1.713 | 1.833 | 1.747 | 1.696 | 1.848 | 2.070 | 2.545 | 2.381 | 1.911 | 1.727 |
| 2006 | 1.855 | 1.807 | 1.989 | 2.300 | 2.392 | 2.413 | 2.522 | 2.597 | 2.381 | 1.924 | 1.746 | 1.761 |
| 2007 | 1.722 | 1.789 | 2.098 | 2.383 | 2.835 | 2.790 | 2.673 | 2.479 | 2.471 | 2.398 | 2.629 | 2.450 |
| 2008 | 2.458 | 2.534 | 2.708 | 2.946 | 3.291 | 3.525 | 3.585 | 3.412 | 3.237 | 2.623 | 1.590 | 1.168 |
| 2009 | 1.201 | 1.408 | 1.454 | 1.597 | 1.829 | 2.101 | 2.044 | 2.100 | 2.028 | 2.010 | 2.118 | 2.045 |
| 2010 | 2.123 | 2.107 | 2.237 | 2.293 | 2.301 | 2.220 | 2.235 | 2.272 | 2.303 | 2.276 | 2.288 | 2.326 |
| 2011 | 2.495 | 2.623 | 2.946 | 3.160 | 3.326 | 3.216 | 3.055 | 3.038 | 3.078 | 3.028 | 2.969 | 2.728 |
| 2012 | 2.641 | 2.712 | 3.170 | 3.499 | 3.415 | 3.297 | 3.169 | 3.129 | 3.294 | 3.270 | 3.033 | 2.769 |
| 2013 | 2.507 | 2.991 | 3.133 | 3.091 | 3.361 | 3.326 | 3.162 | 3.166 | 3.150 | 2.989 | 2.795 | 2.698 |
| 2014 | 2.781 | 2.840 | 3.217 | 3.159 | 3.148 | 3.161 | 3.248 | 3.280 | 3.186 | 2.881 | 2.583 | 2.131 |
| 2015 | 1.607 | 1.780 | 1.889 | 1.995 | 2.250 | 2.315 | 2.419 | 2.497 | 2.253 | 1.961 | 1.700 | 1.591 |
| 2016 | 1.500 | 1.312 | 1.604 | 1.756 | 1.879 | 1.933 | 1.867 | 1.829 | 1.873 | 1.867 | 1.773 | 1.797 |
| 2017 | 1.962 | 1.909 | 1.918 | 2.053 | 2.058 | 2.023 | 1.980 | 2.058 | 2.224 | 2.156 | 2.247 | 2.152 |
| 2018 | 2.101 | 2.133 | 2.130 | 2.312 | 2.536 | 2.562 | 2.508 | 2.513 | 2.604 | 2.623 | 2.401 | 2.079 |
| 2019 | 1.826 | 1.820 | 2.131 | 2.426 | 2.589 | 2.449 | 2.328 | 2.223 | 2.383 | 2.453 | 2.515 | 2.408 |
| 2020 | 2.270 | 2.108 | 1.883 | 1.480 | 1.584 | 1.979 | 2.094 | 2.037 | 1.961 | 1.899 | 1.829 | 1.854 |
| 2021 | 1.978 | 2.170 | 2.571 | 2.650 | 2.753 | W | W | W | W | W | W | W |
| 2022 | W | W | W | |||||||||
| - = No Data Reported; -- = Not Applicable; NA = Not Available; W = Withheld to avoid disclosure of individual company data. |
| Release Date: 6/1/2022 |
| Next Release Date: TBD |