|
Download Data (XLS File) |
|
||||||||
|
||||||||
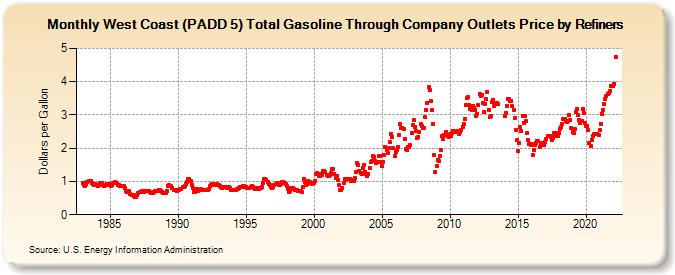
| West Coast (PADD 5) Total Gasoline Through Company Outlets Price by Refiners (Dollars per Gallon) | ||||||||
| Year | Jan | Feb | Mar | Apr | May | Jun | Jul | Aug | Sep | Oct | Nov | Dec |
|---|---|---|---|---|---|---|---|---|---|---|---|---|
| 1983 | 0.951 | 0.882 | 0.857 | 0.912 | 0.974 | 1.002 | 1.024 | 1.007 | 0.964 | 0.910 | 0.908 | 0.926 |
| 1984 | 0.907 | 0.872 | 0.889 | 0.943 | 0.967 | 0.943 | 0.885 | 0.863 | 0.880 | 0.921 | 0.925 | 0.912 |
| 1985 | 0.888 | 0.863 | 0.890 | 0.944 | 0.969 | 0.965 | 0.939 | 0.899 | 0.888 | 0.874 | 0.873 | 0.875 |
| 1986 | 0.868 | 0.811 | 0.705 | 0.679 | 0.707 | 0.703 | 0.632 | 0.590 | 0.596 | 0.549 | 0.524 | 0.541 |
| 1987 | 0.582 | 0.659 | 0.679 | 0.694 | 0.703 | 0.701 | 0.688 | 0.703 | 0.707 | 0.712 | 0.698 | 0.680 |
| 1988 | 0.661 | 0.642 | 0.642 | 0.693 | 0.714 | 0.723 | 0.726 | 0.728 | 0.735 | 0.715 | 0.680 | 0.659 |
| 1989 | 0.640 | 0.652 | 0.708 | 0.875 | 0.891 | 0.878 | 0.849 | 0.796 | 0.756 | 0.753 | 0.733 | 0.724 |
| 1990 | 0.749 | 0.752 | 0.768 | 0.786 | 0.820 | 0.840 | 0.871 | 0.930 | 0.989 | 1.066 | 1.072 | 1.009 |
| 1991 | 0.903 | 0.792 | 0.686 | 0.691 | 0.757 | 0.766 | 0.723 | 0.740 | 0.759 | 0.750 | 0.741 | 0.733 |
| 1992 | 0.739 | 0.742 | 0.741 | 0.777 | 0.856 | 0.899 | 0.923 | 0.912 | 0.893 | 0.903 | 0.919 | 0.895 |
| 1993 | 0.882 | 0.861 | 0.824 | 0.809 | 0.827 | 0.837 | 0.831 | 0.815 | 0.811 | 0.838 | 0.799 | 0.756 |
| 1994 | 0.734 | 0.731 | 0.734 | 0.746 | 0.765 | 0.785 | 0.812 | 0.835 | 0.837 | 0.849 | 0.850 | 0.830 |
| 1995 | 0.831 | 0.808 | 0.790 | 0.802 | 0.844 | 0.853 | 0.837 | 0.810 | 0.785 | 0.801 | 0.794 | 0.782 |
| 1996 | 0.794 | 0.798 | 0.837 | 0.955 | 1.082 | 1.063 | 1.029 | 0.973 | 0.915 | 0.886 | 0.831 | 0.809 |
| 1997 | 0.843 | 0.889 | 0.911 | 0.954 | 0.944 | 0.908 | 0.883 | 0.922 | 0.986 | 0.993 | 0.959 | 0.912 |
| 1998 | 0.863 | 0.761 | 0.687 | 0.722 | 0.804 | 0.790 | 0.767 | 0.755 | 0.741 | 0.738 | 0.723 | 0.715 |
| 1999 | 0.716 | 0.696 | 0.819 | 1.080 | 0.990 | 0.893 | 0.936 | 1.020 | 0.979 | 0.940 | 0.936 | 0.962 |
| 2000 | 0.952 | 1.001 | 1.236 | 1.248 | 1.164 | 1.160 | 1.227 | 1.208 | 1.301 | 1.304 | 1.279 | 1.207 |
| 2001 | 1.153 | 1.163 | 1.196 | 1.261 | 1.373 | 1.362 | 1.234 | 1.092 | 1.149 | 1.056 | 0.901 | 0.733 |
| 2002 | 0.751 | 0.803 | 0.950 | 1.072 | 1.057 | 1.082 | 1.088 | 1.077 | 1.059 | 1.022 | 1.056 | 1.011 |
| 2003 | 1.089 | 1.291 | 1.558 | 1.504 | 1.321 | 1.251 | 1.230 | 1.400 | 1.497 | 1.296 | 1.215 | 1.157 |
| 2004 | 1.224 | 1.414 | 1.573 | 1.616 | 1.754 | 1.747 | 1.629 | 1.551 | 1.576 | 1.771 | 1.767 | 1.579 |
| 2005 | 1.451 | 1.589 | 1.781 | 2.024 | 1.953 | 1.846 | 1.993 | 2.173 | 2.420 | 2.331 | 2.006 | 1.751 |
| 2006 | 1.873 | 1.941 | 2.046 | 2.391 | 2.729 | 2.620 | 2.615 | 2.566 | 2.283 | 1.967 | 1.941 | 2.047 |
| 2007 | 2.032 | 2.090 | 2.467 | 2.690 | 2.842 | 2.638 | 2.505 | 2.318 | 2.350 | 2.487 | 2.729 | 2.670 |
| 2008 | 2.619 | 2.604 | 2.924 | 3.142 | 3.361 | 3.825 | 3.738 | 3.414 | 3.149 | 2.727 | 1.795 | 1.279 |
| 2009 | 1.466 | 1.658 | 1.619 | 1.770 | 1.954 | 2.361 | 2.284 | 2.406 | 2.483 | 2.397 | 2.358 | 2.328 |
| 2010 | 2.417 | 2.355 | 2.469 | 2.502 | 2.494 | 2.484 | 2.517 | 2.526 | 2.412 | 2.499 | 2.537 | 2.645 |
| 2011 | 2.733 | 2.883 | 3.294 | 3.510 | 3.531 | 3.285 | 3.173 | 3.146 | 3.274 | 3.200 | 3.153 | 2.956 |
| 2012 | 3.042 | 3.285 | 3.640 | 3.555 | 3.603 | 3.352 | 3.088 | 3.332 | 3.469 | 3.694 | 3.155 | 2.927 |
| 2013 | 2.975 | 3.400 | 3.446 | 3.281 | 3.340 | 3.348 | 3.322 | NA | NA | NA | NA | NA |
| 2014 | 2.962 | 3.060 | 3.280 | 3.465 | 3.487 | 3.429 | 3.423 | 3.262 | 3.149 | 2.893 | 2.560 | 2.245 |
| 2015 | 1.917 | 2.162 | 2.633 | 2.514 | 2.964 | 2.767 | 2.972 | 2.804 | 2.448 | 2.249 | 2.124 | 2.099 |
| 2016 | 2.117 | 1.805 | 1.957 | 2.101 | 2.148 | 2.210 | 2.208 | 2.039 | 2.118 | 2.169 | 2.139 | 2.086 |
| 2017 | 2.194 | 2.264 | 2.356 | 2.355 | 2.366 | 2.330 | 2.240 | 2.314 | 2.458 | 2.363 | 2.466 | 2.377 |
| 2018 | 2.448 | 2.583 | 2.640 | 2.741 | 2.886 | 2.890 | 2.814 | 2.795 | 2.830 | 2.986 | 2.847 | 2.614 |
| 2019 | 2.474 | 2.463 | 2.589 | 3.100 | 3.186 | 2.987 | 2.859 | 2.767 | 2.828 | 3.172 | 3.050 | 2.765 |
| 2020 | 2.664 | 2.655 | 2.534 | 2.154 | 2.063 | 2.256 | 2.353 | 2.417 | 2.417 | 2.419 | 2.425 | 2.409 |
| 2021 | 2.539 | 2.739 | 3.039 | 3.153 | 3.331 | 3.484 | 3.578 | 3.637 | 3.645 | 3.713 | 3.873 | 3.878 |
| 2022 | 3.870 | 3.932 | 4.755 | |||||||||
| - = No Data Reported; -- = Not Applicable; NA = Not Available; W = Withheld to avoid disclosure of individual company data. |
| Release Date: 6/1/2022 |
| Next Release Date: TBD |