|
Download Data (XLS File) |
|
||||||||
|
||||||||
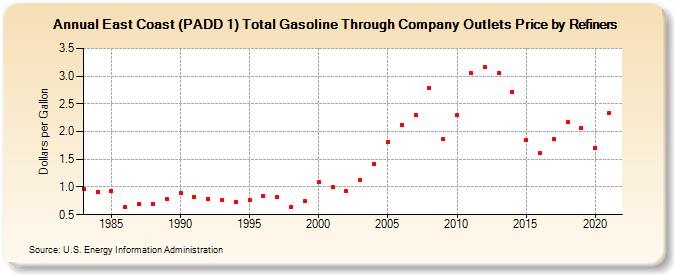
| East Coast (PADD 1) Total Gasoline Through Company Outlets Price by Refiners (Dollars per Gallon) | ||||||||
| Decade | Year-0 | Year-1 | Year-2 | Year-3 | Year-4 | Year-5 | Year-6 | Year-7 | Year-8 | Year-9 |
|---|---|---|---|---|---|---|---|---|---|---|
| 1980's | 0.970 | 0.915 | 0.934 | 0.641 | 0.691 | 0.698 | 0.781 | |||
| 1990's | 0.900 | 0.823 | 0.792 | 0.764 | 0.734 | 0.771 | 0.834 | 0.825 | 0.644 | 0.741 |
| 2000's | 1.094 | 0.998 | 0.925 | 1.121 | 1.413 | 1.819 | 2.120 | 2.303 | 2.788 | 1.871 |
| 2010's | 2.291 | 3.054 | 3.172 | 3.058 | 2.716 | 1.851 | 1.612 | 1.867 | 2.174 | 2.062 |
| 2020's | 1.711 |
| - = No Data Reported; -- = Not Applicable; NA = Not Available; W = Withheld to avoid disclosure of individual company data. |
| Release Date: 6/1/2022 |
| Next Release Date: TBD |