|
Download Data (XLS File) |
|
||||||||
|
||||||||
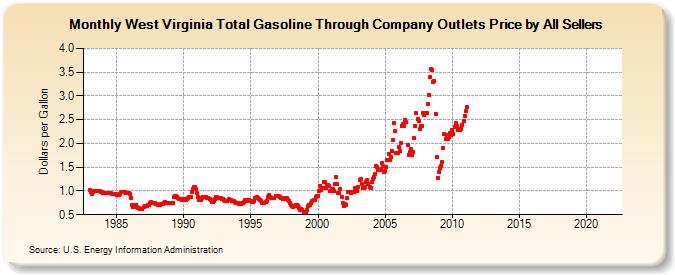
| West Virginia Total Gasoline Through Company Outlets Price by All Sellers (Dollars per Gallon) | ||||||||
| Year | Jan | Feb | Mar | Apr | May | Jun | Jul | Aug | Sep | Oct | Nov | Dec |
|---|---|---|---|---|---|---|---|---|---|---|---|---|
| 1983 | 1.024 | 0.982 | 0.940 | 0.984 | 1.000 | 1.004 | 0.993 | 0.999 | 0.995 | 0.993 | 0.986 | 0.979 |
| 1984 | 0.954 | 0.948 | 0.952 | 0.960 | 0.962 | 0.962 | 0.957 | 0.951 | 0.944 | 0.942 | 0.938 | 0.932 |
| 1985 | 0.914 | 0.906 | 0.925 | 0.943 | 0.968 | 0.975 | 0.980 | 0.978 | 0.967 | 0.963 | 0.967 | 0.965 |
| 1986 | 0.939 | 0.858 | 0.701 | 0.664 | 0.699 | 0.710 | 0.659 | 0.649 | 0.646 | 0.616 | 0.610 | 0.621 |
| 1987 | 0.661 | 0.685 | 0.686 | 0.687 | 0.704 | 0.708 | 0.736 | 0.760 | 0.753 | 0.747 | 0.741 | 0.734 |
| 1988 | 0.720 | 0.706 | 0.699 | 0.708 | 0.726 | 0.729 | 0.749 | 0.758 | 0.754 | 0.748 | 0.749 | 0.746 |
| 1989 | 0.745 | 0.742 | 0.751 | 0.863 | 0.897 | 0.889 | 0.879 | 0.842 | 0.823 | 0.821 | 0.803 | 0.825 |
| 1990 | 0.834 | 0.824 | 0.812 | 0.823 | 0.853 | 0.864 | 0.863 | 0.982 | 1.051 | 1.090 | 1.093 | 1.033 |
| 1991 | 0.954 | 0.863 | 0.811 | 0.814 | 0.853 | 0.871 | 0.870 | 0.872 | 0.873 | 0.860 | 0.862 | 0.840 |
| 1992 | 0.807 | 0.777 | 0.778 | 0.795 | 0.828 | 0.863 | 0.863 | 0.851 | 0.851 | 0.845 | 0.841 | 0.837 |
| 1993 | 0.812 | 0.793 | 0.784 | 0.791 | 0.821 | 0.818 | 0.815 | 0.795 | 0.783 | 0.779 | 0.761 | 0.748 |
| 1994 | 0.740 | 0.731 | 0.721 | 0.728 | 0.739 | 0.745 | 0.769 | 0.812 | 0.811 | 0.792 | 0.811 | 0.792 |
| 1995 | 0.783 | 0.772 | 0.763 | 0.791 | 0.860 | 0.873 | 0.857 | 0.825 | 0.801 | 0.780 | 0.755 | 0.755 |
| 1996 | 0.756 | 0.764 | 0.797 | 0.872 | 0.909 | 0.881 | 0.855 | 0.847 | 0.844 | 0.851 | 0.895 | 0.902 |
| 1997 | 0.904 | 0.898 | 0.872 | 0.860 | 0.845 | 0.835 | 0.822 | 0.845 | 0.844 | 0.818 | 0.788 | 0.750 |
| 1998 | 0.712 | 0.686 | 0.666 | 0.679 | 0.711 | 0.707 | 0.681 | 0.631 | 0.608 | 0.617 | 0.609 | 0.561 |
| 1999 | 0.553 | 0.528 | 0.595 | 0.684 | 0.709 | 0.702 | 0.744 | 0.786 | 0.809 | 0.816 | 0.865 | 0.891 |
| 2000 | 0.902 | 1.007 | 1.107 | 1.011 | 1.056 | 1.196 | 1.182 | 1.070 | 1.130 | 1.119 | 1.111 | 1.003 |
| 2001 | 1.034 | 1.051 | 0.990 | 1.152 | 1.284 | 1.148 | 0.950 | 0.962 | 1.048 | 0.882 | 0.748 | 0.688 |
| 2002 | 0.723 | 0.711 | 0.850 | 0.985 | 0.980 | 0.960 | 0.970 | 0.969 | 0.985 | 1.065 | 1.025 | 1.000 |
| 2003 | 1.078 | 1.222 | 1.255 | 1.146 | 1.062 | 1.058 | 1.089 | 1.195 | 1.225 | 1.142 | 1.086 | 1.058 |
| 2004 | 1.195 | 1.253 | 1.298 | 1.365 | 1.530 | 1.497 | 1.450 | 1.440 | 1.452 | 1.579 | 1.526 | 1.395 |
| 2005 | 1.416 | 1.494 | 1.643 | 1.778 | 1.656 | 1.708 | 1.838 | 2.068 | 2.426 | 2.252 | 1.805 | 1.791 |
| 2006 | 1.935 | 1.850 | 2.006 | 2.371 | 2.402 | 2.369 | 2.501 | 2.445 | 1.976 | 1.760 | 1.810 | 1.876 |
| 2007 | 1.763 | 1.825 | 2.107 | 2.372 | 2.634 | 2.506 | 2.464 | 2.298 | 2.361 | 2.368 | 2.631 | 2.589 |
| 2008 | 2.643 | 2.637 | 2.834 | 3.026 | 3.406 | 3.564 | 3.542 | 3.302 | 3.309 | 2.616 | 1.705 | 1.280 |
| 2009 | 1.397 | 1.481 | 1.534 | 1.614 | 1.903 | 2.206 | 2.086 | 2.171 | 2.090 | 2.126 | 2.217 | 2.183 |
| 2010 | 2.276 | 2.208 | 2.348 | 2.420 | 2.370 | 2.289 | 2.314 | 2.283 | 2.303 | 2.384 | 2.464 | 2.583 |
| 2011 | 2.686 | 2.766 | - | - | - | - | - | - | - | - | - | - |
| 2012 | - | - | - | - | - | - | - | - | - | - | - | - |
| 2013 | - | - | - | - | - | - | - | - | - | - | - | - |
| 2014 | - | - | - | - | - | - | - | - | - | - | - | - |
| 2015 | - | - | - | - | - | - | - | - | - | - | - | - |
| 2016 | - | - | - | - | - | - | - | - | - | - | - | - |
| 2017 | - | - | - | - | - | - | - | - | - | - | - | - |
| 2018 | - | - | - | - | - | - | - | - | - | - | - | - |
| 2019 | - | - | - | - | - | - | - | - | - | - | - | - |
| 2020 | - | - | - | - | - | - | - | - | - | - | - | - |
| 2021 | - | - | - | - | - | - | - | - | - | - | - | - |
| 2022 | - | - | - | |||||||||
| - = No Data Reported; -- = Not Applicable; NA = Not Available; W = Withheld to avoid disclosure of individual company data. |
| Release Date: 6/1/2022 |
| Next Release Date: TBD |