|
Download Data (XLS File) |
|
||||||||
|
||||||||
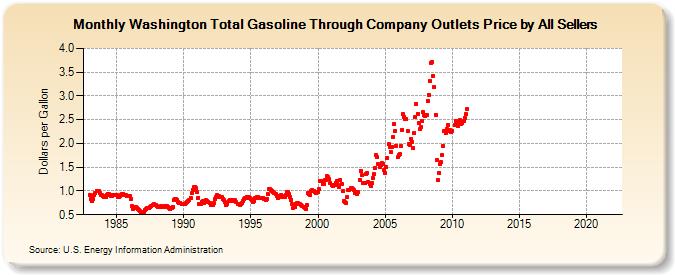
| Washington Total Gasoline Through Company Outlets Price by All Sellers (Dollars per Gallon) | ||||||||
| Year | Jan | Feb | Mar | Apr | May | Jun | Jul | Aug | Sep | Oct | Nov | Dec |
|---|---|---|---|---|---|---|---|---|---|---|---|---|
| 1983 | 0.917 | 0.831 | 0.783 | 0.826 | 0.905 | 0.962 | 1.002 | 0.997 | 0.990 | 0.956 | 0.924 | 0.907 |
| 1984 | 0.897 | 0.867 | 0.872 | 0.923 | 0.940 | 0.934 | 0.912 | 0.896 | 0.902 | 0.919 | 0.923 | 0.918 |
| 1985 | 0.905 | 0.879 | 0.865 | 0.886 | 0.924 | 0.943 | 0.937 | 0.916 | 0.908 | 0.900 | 0.892 | 0.899 |
| 1986 | 0.886 | 0.835 | 0.673 | 0.622 | 0.646 | 0.662 | 0.645 | 0.615 | 0.608 | 0.571 | 0.542 | 0.541 |
| 1987 | 0.567 | 0.601 | 0.616 | 0.631 | 0.631 | 0.641 | 0.657 | 0.688 | 0.705 | 0.718 | 0.711 | 0.703 |
| 1988 | 0.681 | 0.664 | 0.652 | 0.657 | 0.673 | 0.672 | 0.672 | 0.683 | 0.682 | 0.675 | 0.661 | 0.644 |
| 1989 | 0.626 | 0.635 | 0.667 | 0.805 | 0.830 | 0.823 | 0.812 | 0.776 | 0.741 | 0.751 | 0.734 | 0.716 |
| 1990 | 0.728 | 0.731 | 0.736 | 0.766 | 0.788 | 0.820 | 0.858 | 0.949 | 1.015 | 1.076 | 1.090 | 1.056 |
| 1991 | 0.979 | 0.862 | 0.721 | 0.717 | 0.773 | 0.786 | 0.756 | 0.769 | 0.800 | 0.790 | 0.776 | 0.749 |
| 1992 | 0.707 | 0.695 | 0.697 | 0.736 | 0.835 | 0.880 | 0.905 | 0.894 | 0.871 | 0.872 | 0.871 | 0.839 |
| 1993 | 0.807 | 0.759 | 0.695 | 0.721 | 0.785 | 0.813 | 0.806 | 0.792 | 0.784 | 0.810 | 0.803 | 0.760 |
| 1994 | 0.723 | 0.716 | 0.714 | 0.726 | 0.757 | 0.785 | 0.822 | 0.855 | 0.863 | 0.855 | 0.865 | 0.843 |
| 1995 | 0.822 | 0.806 | 0.778 | 0.792 | 0.847 | 0.871 | 0.874 | 0.857 | 0.852 | 0.856 | 0.855 | 0.844 |
| 1996 | 0.831 | 0.813 | 0.826 | 0.926 | 1.038 | 1.040 | 1.021 | 0.996 | 0.982 | 0.967 | 0.927 | 0.884 |
| 1997 | 0.852 | 0.882 | 0.890 | 0.912 | 0.904 | 0.882 | 0.867 | 0.908 | 0.970 | 0.969 | 0.929 | 0.874 |
| 1998 | 0.816 | 0.718 | 0.649 | 0.666 | 0.727 | 0.746 | 0.743 | 0.730 | 0.718 | 0.706 | 0.679 | 0.668 |
| 1999 | 0.649 | 0.619 | 0.710 | 0.953 | 0.929 | 0.923 | 0.999 | 1.024 | 1.004 | 0.976 | 0.957 | 0.977 |
| 2000 | 0.977 | 1.032 | 1.205 | 1.207 | 1.152 | 1.152 | 1.224 | 1.239 | 1.305 | 1.294 | 1.242 | 1.172 |
| 2001 | 1.118 | 1.107 | 1.127 | 1.131 | 1.173 | 1.202 | 1.125 | 1.079 | 1.232 | 1.156 | 0.993 | 0.797 |
| 2002 | 0.767 | 0.749 | 0.871 | 1.014 | 1.023 | 1.055 | 1.053 | 1.047 | 1.015 | 0.966 | 0.972 | 0.942 |
| 2003 | 0.981 | 1.238 | 1.426 | 1.326 | 1.174 | 1.158 | 1.168 | 1.358 | 1.374 | 1.194 | 1.146 | 1.098 |
| 2004 | 1.176 | 1.268 | 1.350 | 1.478 | 1.757 | 1.705 | 1.561 | 1.508 | 1.544 | 1.584 | 1.575 | 1.439 |
| 2005 | 1.371 | 1.502 | 1.696 | 1.981 | 1.928 | 1.820 | 1.933 | 2.139 | 2.406 | 2.262 | 1.943 | 1.709 |
| 2006 | 1.761 | 1.770 | 1.947 | 2.291 | 2.610 | 2.564 | 2.508 | 2.510 | 2.266 | 1.989 | 1.970 | 2.090 |
| 2007 | 2.038 | 1.909 | 2.222 | 2.551 | 2.834 | 2.623 | 2.437 | 2.294 | 2.346 | 2.464 | 2.659 | 2.595 |
| 2008 | 2.569 | 2.597 | 2.900 | 3.023 | 3.310 | 3.695 | 3.719 | 3.421 | 3.189 | 2.607 | 1.648 | 1.228 |
| 2009 | 1.387 | 1.564 | 1.601 | 1.752 | 1.943 | 2.254 | 2.212 | 2.306 | 2.380 | 2.254 | 2.280 | 2.235 |
| 2010 | 2.267 | NA | 2.383 | 2.475 | 2.447 | 2.372 | 2.418 | 2.486 | 2.412 | 2.434 | 2.476 | 2.544 |
| 2011 | 2.615 | 2.719 | - | - | - | - | - | - | - | - | - | - |
| 2012 | - | - | - | - | - | - | - | - | - | - | - | - |
| 2013 | - | - | - | - | - | - | - | - | - | - | - | - |
| 2014 | - | - | - | - | - | - | - | - | - | - | - | - |
| 2015 | - | - | - | - | - | - | - | - | - | - | - | - |
| 2016 | - | - | - | - | - | - | - | - | - | - | - | - |
| 2017 | - | - | - | - | - | - | - | - | - | - | - | - |
| 2018 | - | - | - | - | - | - | - | - | - | - | - | - |
| 2019 | - | - | - | - | - | - | - | - | - | - | - | - |
| 2020 | - | - | - | - | - | - | - | - | - | - | - | - |
| 2021 | - | - | - | - | - | - | - | - | - | - | - | - |
| 2022 | - | - | - | |||||||||
| - = No Data Reported; -- = Not Applicable; NA = Not Available; W = Withheld to avoid disclosure of individual company data. |
| Release Date: 6/1/2022 |
| Next Release Date: TBD |