|
Download Data (XLS File) |
|
||||||||
|
||||||||
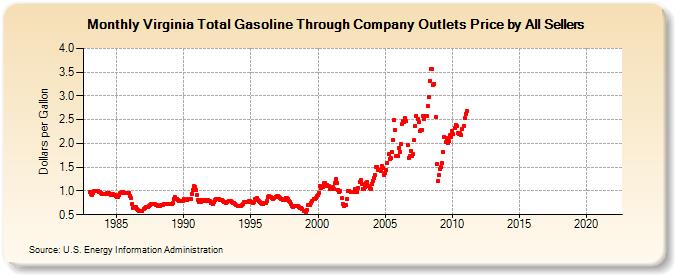
| Virginia Total Gasoline Through Company Outlets Price by All Sellers (Dollars per Gallon) | ||||||||
| Year | Jan | Feb | Mar | Apr | May | Jun | Jul | Aug | Sep | Oct | Nov | Dec |
|---|---|---|---|---|---|---|---|---|---|---|---|---|
| 1983 | 0.975 | 0.941 | 0.923 | 0.949 | 0.992 | 1.001 | 0.993 | 0.991 | 0.983 | 0.972 | 0.956 | 0.940 |
| 1984 | 0.926 | 0.939 | 0.945 | 0.947 | 0.948 | 0.948 | 0.934 | 0.923 | 0.924 | 0.927 | 0.914 | 0.899 |
| 1985 | 0.883 | 0.875 | 0.912 | 0.948 | 0.966 | 0.977 | 0.972 | 0.963 | 0.949 | 0.950 | 0.961 | 0.967 |
| 1986 | 0.904 | 0.842 | 0.727 | 0.644 | 0.664 | 0.658 | 0.610 | 0.591 | 0.587 | 0.570 | 0.568 | 0.576 |
| 1987 | 0.621 | 0.643 | 0.656 | 0.667 | 0.668 | 0.684 | 0.697 | 0.720 | 0.724 | 0.720 | 0.720 | 0.708 |
| 1988 | 0.701 | 0.687 | 0.681 | 0.689 | 0.703 | 0.702 | 0.719 | 0.727 | 0.729 | 0.723 | 0.723 | 0.721 |
| 1989 | 0.720 | 0.725 | 0.745 | 0.841 | 0.868 | 0.841 | 0.832 | 0.815 | 0.797 | 0.789 | 0.786 | 0.794 |
| 1990 | 0.839 | 0.820 | 0.805 | 0.812 | 0.821 | 0.831 | 0.829 | 0.939 | 1.018 | 1.095 | 1.083 | 1.020 |
| 1991 | 0.916 | 0.815 | 0.770 | 0.773 | 0.817 | 0.816 | 0.795 | 0.811 | 0.815 | 0.792 | 0.807 | 0.785 |
| 1992 | 0.748 | 0.736 | 0.735 | 0.762 | 0.801 | 0.836 | 0.833 | 0.825 | 0.819 | 0.809 | 0.805 | 0.786 |
| 1993 | 0.774 | 0.758 | 0.753 | 0.776 | 0.793 | 0.790 | 0.783 | 0.766 | 0.752 | 0.747 | 0.734 | 0.699 |
| 1994 | 0.683 | 0.680 | 0.678 | 0.689 | 0.698 | 0.722 | 0.765 | 0.777 | 0.773 | 0.764 | 0.789 | 0.784 |
| 1995 | 0.772 | 0.760 | 0.744 | 0.776 | 0.837 | 0.843 | 0.810 | 0.779 | 0.764 | 0.745 | 0.723 | 0.727 |
| 1996 | 0.737 | 0.740 | 0.779 | 0.869 | 0.901 | 0.879 | 0.865 | 0.844 | 0.841 | 0.850 | 0.880 | 0.887 |
| 1997 | 0.888 | 0.873 | 0.855 | 0.832 | 0.825 | 0.815 | 0.808 | 0.852 | 0.852 | 0.829 | 0.796 | 0.770 |
| 1998 | 0.724 | 0.688 | 0.667 | 0.677 | 0.689 | 0.684 | 0.676 | 0.658 | 0.639 | 0.647 | 0.628 | 0.585 |
| 1999 | 0.579 | 0.559 | 0.607 | 0.695 | 0.708 | 0.703 | 0.750 | 0.798 | 0.839 | 0.841 | 0.856 | 0.895 |
| 2000 | 0.908 | 0.967 | 1.099 | 1.053 | 1.087 | 1.159 | 1.166 | 1.106 | 1.120 | 1.110 | 1.098 | 1.041 |
| 2001 | 1.070 | 1.084 | 1.038 | 1.168 | 1.245 | 1.173 | 1.021 | 0.974 | 0.994 | 0.847 | 0.722 | 0.674 |
| 2002 | 0.706 | 0.701 | 0.838 | 1.008 | 1.000 | 0.974 | 0.972 | 0.971 | 0.974 | 1.032 | 1.002 | 0.983 |
| 2003 | 1.058 | 1.188 | 1.225 | 1.142 | 1.048 | 1.040 | 1.078 | 1.167 | 1.181 | 1.104 | 1.057 | 1.037 |
| 2004 | 1.156 | 1.212 | 1.278 | 1.334 | 1.507 | 1.508 | 1.448 | 1.432 | 1.425 | 1.534 | 1.482 | 1.342 |
| 2005 | 1.378 | 1.439 | 1.598 | 1.769 | 1.666 | 1.698 | 1.830 | 2.064 | 2.499 | 2.287 | 1.735 | 1.734 |
| 2006 | 1.897 | 1.825 | 1.983 | 2.401 | 2.472 | 2.445 | 2.535 | 2.462 | 1.961 | 1.701 | 1.734 | 1.847 |
| 2007 | 1.745 | 1.774 | 2.062 | 2.372 | 2.584 | 2.511 | 2.442 | 2.253 | 2.274 | 2.289 | 2.571 | 2.509 |
| 2008 | 2.570 | 2.571 | 2.798 | 2.969 | 3.316 | 3.560 | 3.564 | 3.224 | 3.261 | 2.555 | 1.566 | 1.208 |
| 2009 | 1.327 | 1.465 | 1.498 | 1.586 | 1.828 | 2.133 | 2.020 | 2.117 | 2.005 | 2.047 | 2.170 | 2.140 |
| 2010 | 2.256 | 2.188 | 2.318 | 2.397 | 2.374 | 2.217 | 2.195 | 2.214 | 2.168 | 2.306 | 2.368 | 2.528 |
| 2011 | 2.625 | 2.692 | - | - | - | - | - | - | - | - | - | - |
| 2012 | - | - | - | - | - | - | - | - | - | - | - | - |
| 2013 | - | - | - | - | - | - | - | - | - | - | - | - |
| 2014 | - | - | - | - | - | - | - | - | - | - | - | - |
| 2015 | - | - | - | - | - | - | - | - | - | - | - | - |
| 2016 | - | - | - | - | - | - | - | - | - | - | - | - |
| 2017 | - | - | - | - | - | - | - | - | - | - | - | - |
| 2018 | - | - | - | - | - | - | - | - | - | - | - | - |
| 2019 | - | - | - | - | - | - | - | - | - | - | - | - |
| 2020 | - | - | - | - | - | - | - | - | - | - | - | - |
| 2021 | - | - | - | - | - | - | - | - | - | - | - | - |
| 2022 | - | - | - | |||||||||
| - = No Data Reported; -- = Not Applicable; NA = Not Available; W = Withheld to avoid disclosure of individual company data. |
| Release Date: 6/1/2022 |
| Next Release Date: TBD |