|
Download Data (XLS File) |
|
||||||||
|
||||||||
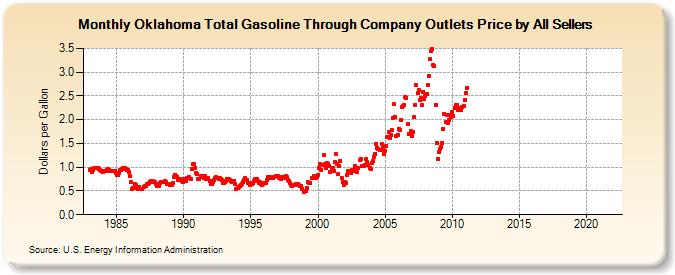
| Oklahoma Total Gasoline Through Company Outlets Price by All Sellers (Dollars per Gallon) | ||||||||
| Year | Jan | Feb | Mar | Apr | May | Jun | Jul | Aug | Sep | Oct | Nov | Dec |
|---|---|---|---|---|---|---|---|---|---|---|---|---|
| 1983 | 0.950 | 0.954 | 0.900 | 0.946 | 0.986 | 0.991 | 0.990 | 0.992 | 0.956 | 0.948 | 0.913 | 0.912 |
| 1984 | 0.906 | 0.912 | 0.920 | 0.949 | 0.960 | 0.948 | 0.928 | 0.910 | 0.910 | 0.918 | 0.918 | 0.879 |
| 1985 | 0.833 | 0.830 | 0.885 | 0.931 | 0.950 | 0.959 | 0.977 | 0.974 | 0.952 | 0.935 | 0.940 | 0.890 |
| 1986 | 0.812 | 0.687 | 0.543 | 0.566 | 0.640 | 0.622 | 0.560 | 0.551 | 0.588 | 0.536 | 0.536 | 0.536 |
| 1987 | 0.589 | 0.608 | 0.613 | 0.644 | 0.653 | 0.669 | 0.698 | 0.719 | 0.704 | 0.682 | 0.694 | 0.652 |
| 1988 | 0.608 | 0.603 | 0.607 | 0.658 | 0.686 | 0.679 | 0.695 | 0.707 | 0.678 | 0.649 | 0.652 | 0.640 |
| 1989 | 0.620 | 0.623 | 0.662 | 0.798 | 0.836 | 0.820 | 0.796 | 0.723 | 0.743 | 0.742 | 0.705 | 0.692 |
| 1990 | 0.749 | 0.738 | 0.716 | 0.768 | 0.782 | 0.784 | 0.742 | 0.960 | 1.063 | 1.066 | 0.979 | 0.885 |
| 1991 | 0.849 | 0.748 | 0.760 | 0.814 | 0.825 | 0.787 | 0.777 | 0.816 | 0.755 | 0.744 | 0.769 | 0.708 |
| 1992 | 0.649 | 0.654 | 0.695 | 0.728 | 0.773 | 0.785 | 0.766 | 0.759 | 0.769 | 0.752 | 0.722 | 0.677 |
| 1993 | 0.674 | 0.690 | 0.715 | 0.748 | 0.747 | 0.739 | 0.704 | 0.697 | 0.680 | 0.712 | 0.651 | 0.547 |
| 1994 | 0.556 | 0.587 | 0.600 | 0.629 | 0.649 | 0.682 | 0.737 | 0.775 | 0.733 | 0.662 | 0.665 | 0.623 |
| 1995 | 0.643 | 0.637 | 0.660 | 0.705 | 0.754 | 0.743 | 0.700 | 0.677 | 0.681 | 0.642 | 0.630 | 0.655 |
| 1996 | 0.670 | 0.675 | 0.735 | 0.796 | 0.793 | 0.794 | 0.772 | 0.766 | 0.783 | 0.793 | 0.821 | 0.810 |
| 1997 | 0.809 | 0.782 | 0.770 | 0.755 | 0.790 | 0.797 | 0.770 | 0.817 | 0.795 | 0.735 | 0.719 | 0.662 |
| 1998 | 0.624 | 0.603 | 0.617 | 0.624 | 0.649 | 0.643 | 0.643 | 0.615 | 0.597 | 0.608 | 0.548 | 0.475 |
| 1999 | 0.491 | 0.502 | 0.571 | 0.679 | 0.674 | 0.661 | NA | 0.766 | 0.810 | 0.784 | 0.779 | 0.802 |
| 2000 | 0.844 | 0.974 | 1.073 | 0.947 | 1.036 | 1.255 | 1.071 | 0.974 | 1.096 | 1.060 | 1.026 | 0.907 |
| 2001 | 0.975 | 0.979 | 0.921 | 1.114 | 1.278 | 1.069 | 0.848 | 1.023 | 1.137 | 0.779 | 0.678 | 0.633 |
| 2002 | 0.681 | 0.670 | 0.845 | 0.930 | 0.905 | 0.880 | 0.946 | 0.925 | 0.945 | 1.022 | 0.926 | 0.900 |
| 2003 | 0.973 | 1.143 | 1.162 | 1.030 | 1.032 | 1.024 | 1.047 | 1.172 | 1.114 | 1.047 | 0.973 | 0.970 |
| 2004 | 1.097 | 1.140 | 1.225 | 1.285 | 1.496 | 1.404 | 1.390 | 1.372 | 1.362 | 1.490 | 1.414 | 1.276 |
| 2005 | 1.348 | 1.446 | 1.645 | 1.739 | 1.623 | 1.676 | 1.784 | 2.040 | 2.335 | 2.058 | 1.655 | 1.687 |
| 2006 | 1.810 | 1.775 | 1.984 | 2.275 | 2.284 | 2.310 | 2.478 | 2.463 | 1.902 | 1.696 | 1.706 | 1.763 |
| 2007 | 1.657 | 1.736 | 2.059 | 2.314 | 2.724 | 2.555 | 2.617 | 2.413 | 2.450 | 2.300 | 2.591 | 2.437 |
| 2008 | 2.490 | 2.546 | 2.724 | 2.915 | 3.269 | 3.444 | 3.479 | 3.147 | 3.121 | 2.314 | 1.501 | 1.182 |
| 2009 | 1.312 | 1.374 | 1.435 | 1.517 | 1.809 | 2.123 | 1.956 | 2.088 | 1.935 | 1.992 | 2.094 | 2.066 |
| 2010 | 2.156 | 2.082 | 2.252 | 2.319 | 2.310 | 2.196 | 2.240 | 2.214 | 2.211 | 2.267 | 2.296 | 2.421 |
| 2011 | 2.557 | 2.671 | - | - | - | - | - | - | - | - | - | - |
| 2012 | - | - | - | - | - | - | - | - | - | - | - | - |
| 2013 | - | - | - | - | - | - | - | - | - | - | - | - |
| 2014 | - | - | - | - | - | - | - | - | - | - | - | - |
| 2015 | - | - | - | - | - | - | - | - | - | - | - | - |
| 2016 | - | - | - | - | - | - | - | - | - | - | - | - |
| 2017 | - | - | - | - | - | - | - | - | - | - | - | - |
| 2018 | - | - | - | - | - | - | - | - | - | - | - | - |
| 2019 | - | - | - | - | - | - | - | - | - | - | - | - |
| 2020 | - | - | - | - | - | - | - | - | - | - | - | - |
| 2021 | - | - | - | - | - | - | - | - | - | - | - | - |
| 2022 | - | - | - | |||||||||
| - = No Data Reported; -- = Not Applicable; NA = Not Available; W = Withheld to avoid disclosure of individual company data. |
| Release Date: 6/1/2022 |
| Next Release Date: TBD |