|
Download Data (XLS File) |
|
||||||||
|
||||||||
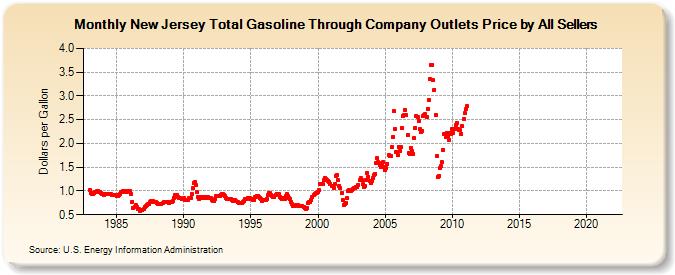
| New Jersey Total Gasoline Through Company Outlets Price by All Sellers (Dollars per Gallon) | ||||||||
| Year | Jan | Feb | Mar | Apr | May | Jun | Jul | Aug | Sep | Oct | Nov | Dec |
|---|---|---|---|---|---|---|---|---|---|---|---|---|
| 1983 | 1.022 | 0.957 | 0.930 | 0.944 | 0.967 | 0.973 | 0.992 | 0.989 | 0.979 | 0.977 | 0.961 | 0.936 |
| 1984 | 0.942 | 0.918 | 0.930 | 0.942 | 0.936 | 0.939 | 0.942 | 0.933 | 0.923 | 0.919 | 0.922 | 0.920 |
| 1985 | 0.904 | 0.896 | 0.921 | 0.946 | 0.974 | 0.978 | 0.993 | 0.992 | 0.981 | 0.987 | 0.995 | 1.004 |
| 1986 | 0.989 | 0.934 | 0.775 | 0.635 | 0.672 | 0.695 | 0.658 | 0.611 | 0.611 | 0.588 | 0.600 | 0.599 |
| 1987 | 0.620 | 0.660 | 0.676 | 0.698 | 0.720 | 0.734 | 0.760 | 0.785 | 0.781 | 0.771 | 0.768 | 0.759 |
| 1988 | 0.743 | 0.732 | 0.718 | 0.720 | 0.732 | 0.740 | 0.762 | 0.772 | 0.764 | 0.759 | 0.759 | 0.757 |
| 1989 | 0.762 | 0.766 | 0.789 | 0.855 | 0.907 | 0.911 | 0.910 | 0.871 | 0.846 | 0.844 | 0.834 | 0.835 |
| 1990 | 0.854 | 0.816 | 0.803 | 0.804 | 0.818 | 0.850 | 0.858 | 0.936 | 1.055 | 1.175 | 1.192 | 1.117 |
| 1991 | 0.970 | 0.880 | 0.834 | 0.859 | 0.879 | 0.872 | 0.850 | 0.873 | 0.875 | 0.859 | 0.870 | 0.858 |
| 1992 | 0.848 | 0.818 | 0.796 | 0.788 | 0.827 | 0.891 | 0.903 | 0.900 | 0.894 | 0.914 | 0.941 | 0.934 |
| 1993 | 0.919 | 0.889 | 0.854 | 0.837 | 0.832 | 0.831 | 0.823 | 0.806 | 0.791 | 0.817 | 0.807 | 0.780 |
| 1994 | 0.760 | 0.753 | 0.748 | 0.737 | 0.739 | 0.778 | 0.796 | 0.830 | 0.840 | 0.850 | 0.860 | 0.850 |
| 1995 | 0.838 | 0.831 | 0.814 | 0.819 | 0.874 | 0.899 | 0.892 | 0.871 | 0.852 | 0.827 | 0.799 | 0.803 |
| 1996 | 0.819 | 0.811 | 0.830 | 0.905 | 0.957 | 0.949 | 0.922 | 0.895 | 0.874 | 0.879 | 0.914 | 0.942 |
| 1997 | 0.943 | 0.927 | 0.883 | 0.851 | 0.828 | 0.842 | 0.832 | 0.892 | 0.926 | 0.899 | 0.861 | 0.821 |
| 1998 | 0.775 | 0.725 | 0.684 | 0.687 | 0.698 | 0.704 | 0.699 | 0.690 | 0.679 | 0.685 | 0.684 | 0.663 |
| 1999 | 0.649 | 0.623 | 0.635 | 0.737 | 0.771 | 0.767 | 0.803 | 0.867 | 0.910 | 0.937 | 0.948 | 0.965 |
| 2000 | 0.979 | 1.015 | 1.147 | 1.140 | 1.136 | 1.223 | 1.279 | 1.245 | 1.234 | 1.216 | 1.190 | 1.145 |
| 2001 | 1.107 | 1.100 | 1.067 | 1.142 | 1.318 | 1.331 | 1.227 | 1.107 | 1.052 | 0.947 | 0.813 | 0.713 |
| 2002 | 0.723 | 0.738 | 0.849 | 0.999 | 1.020 | 1.007 | 1.012 | 1.050 | 1.053 | 1.065 | 1.091 | 1.093 |
| 2003 | 1.121 | 1.225 | 1.270 | 1.225 | 1.143 | 1.093 | 1.105 | 1.229 | 1.379 | 1.304 | 1.216 | 1.161 |
| 2004 | 1.211 | 1.270 | 1.335 | 1.366 | 1.583 | 1.687 | 1.607 | 1.545 | 1.494 | 1.586 | 1.600 | 1.513 |
| 2005 | 1.449 | 1.479 | 1.577 | 1.748 | 1.735 | 1.740 | 1.928 | 2.131 | 2.680 | 2.305 | 1.830 | 1.756 |
| 2006 | 1.926 | 1.848 | 1.916 | 2.332 | 2.575 | 2.592 | 2.694 | 2.593 | 2.181 | 1.789 | 1.771 | 1.912 |
| 2007 | 1.843 | 1.784 | 2.117 | 2.332 | 2.576 | 2.557 | 2.477 | 2.298 | 2.231 | 2.271 | 2.587 | 2.602 |
| 2008 | 2.618 | 2.566 | 2.734 | 2.918 | 3.355 | 3.658 | 3.657 | 3.327 | 3.131 | 2.601 | 1.734 | 1.293 |
| 2009 | 1.319 | 1.479 | 1.515 | 1.599 | 1.859 | 2.190 | 2.132 | 2.222 | 2.159 | 2.081 | 2.224 | 2.194 |
| 2010 | 2.296 | 2.225 | 2.298 | 2.386 | 2.430 | 2.301 | 2.288 | 2.275 | 2.200 | 2.358 | 2.505 | 2.630 |
| 2011 | 2.716 | 2.782 | - | - | - | - | - | - | - | - | - | - |
| 2012 | - | - | - | - | - | - | - | - | - | - | - | - |
| 2013 | - | - | - | - | - | - | - | - | - | - | - | - |
| 2014 | - | - | - | - | - | - | - | - | - | - | - | - |
| 2015 | - | - | - | - | - | - | - | - | - | - | - | - |
| 2016 | - | - | - | - | - | - | - | - | - | - | - | - |
| 2017 | - | - | - | - | - | - | - | - | - | - | - | - |
| 2018 | - | - | - | - | - | - | - | - | - | - | - | - |
| 2019 | - | - | - | - | - | - | - | - | - | - | - | - |
| 2020 | - | - | - | - | - | - | - | - | - | - | - | - |
| 2021 | - | - | - | - | - | - | - | - | - | - | - | - |
| 2022 | - | - | - | |||||||||
| - = No Data Reported; -- = Not Applicable; NA = Not Available; W = Withheld to avoid disclosure of individual company data. |
| Release Date: 6/1/2022 |
| Next Release Date: TBD |