|
Download Data (XLS File) |
|
||||||||
|
||||||||
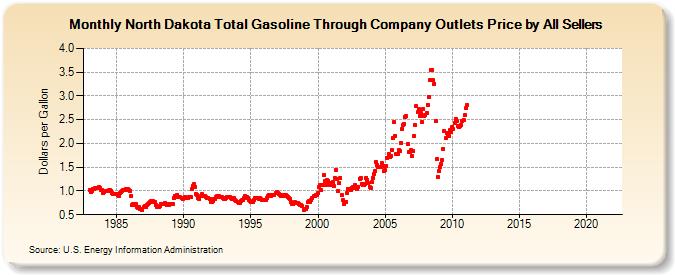
| North Dakota Total Gasoline Through Company Outlets Price by All Sellers (Dollars per Gallon) | ||||||||
| Year | Jan | Feb | Mar | Apr | May | Jun | Jul | Aug | Sep | Oct | Nov | Dec |
|---|---|---|---|---|---|---|---|---|---|---|---|---|
| 1983 | 1.025 | 0.978 | 1.007 | 1.036 | 1.037 | 1.066 | 1.061 | 1.065 | 1.076 | 1.058 | 1.024 | 1.011 |
| 1984 | 0.967 | 0.981 | 1.004 | 1.003 | 0.998 | 1.010 | 1.010 | 0.992 | 0.961 | 0.931 | 0.931 | 0.943 |
| 1985 | 0.932 | 0.920 | 0.891 | 0.951 | 0.979 | 0.998 | 1.010 | 1.017 | 1.043 | 1.020 | 1.033 | 1.014 |
| 1986 | 1.009 | 0.894 | 0.709 | 0.725 | 0.707 | 0.715 | 0.672 | 0.642 | 0.664 | 0.616 | 0.629 | 0.599 |
| 1987 | 0.667 | 0.675 | 0.672 | 0.711 | 0.729 | 0.737 | 0.762 | 0.789 | 0.781 | 0.766 | 0.764 | 0.711 |
| 1988 | 0.671 | 0.660 | 0.668 | 0.692 | 0.731 | 0.735 | 0.733 | 0.754 | 0.720 | 0.697 | 0.719 | 0.705 |
| 1989 | 0.730 | 0.721 | 0.729 | 0.849 | 0.897 | 0.884 | 0.916 | 0.879 | 0.864 | 0.867 | 0.853 | 0.835 |
| 1990 | 0.853 | 0.868 | 0.859 | 0.854 | 0.853 | 0.878 | 0.879 | 1.043 | 1.114 | 1.146 | 1.087 | 0.946 |
| 1991 | 0.922 | 0.850 | 0.827 | 0.887 | 0.929 | 0.887 | 0.899 | 0.898 | 0.869 | 0.857 | 0.857 | 0.833 |
| 1992 | 0.771 | 0.767 | 0.790 | 0.823 | 0.838 | 0.869 | 0.896 | 0.888 | 0.883 | 0.869 | 0.864 | 0.850 |
| 1993 | 0.841 | 0.838 | 0.851 | 0.870 | 0.872 | 0.872 | 0.844 | 0.840 | 0.827 | 0.843 | 0.814 | 0.782 |
| 1994 | 0.760 | 0.757 | 0.745 | 0.781 | 0.803 | 0.812 | 0.842 | 0.889 | 0.880 | 0.848 | 0.818 | 0.791 |
| 1995 | 0.776 | 0.763 | 0.761 | 0.806 | 0.861 | 0.857 | 0.844 | 0.841 | 0.848 | 0.823 | 0.812 | 0.812 |
| 1996 | 0.815 | 0.820 | 0.849 | 0.900 | 0.925 | 0.914 | 0.901 | 0.905 | 0.917 | 0.922 | 0.948 | 0.968 |
| 1997 | 0.966 | 0.946 | 0.925 | 0.890 | 0.904 | 0.919 | 0.900 | 0.917 | 0.900 | 0.864 | 0.859 | 0.828 |
| 1998 | 0.768 | 0.722 | 0.725 | 0.761 | 0.747 | 0.747 | 0.747 | 0.735 | 0.712 | 0.707 | 0.674 | 0.606 |
| 1999 | 0.615 | 0.613 | 0.669 | 0.761 | 0.785 | 0.772 | 0.808 | 0.856 | 0.886 | 0.900 | 0.907 | 0.917 |
| 2000 | 0.953 | 1.074 | 1.127 | 1.012 | 1.129 | 1.331 | 1.203 | 1.118 | 1.232 | 1.210 | 1.176 | 1.120 |
| 2001 | 1.174 | 1.190 | 1.104 | 1.275 | 1.441 | 1.256 | 1.005 | 1.169 | 1.279 | 0.911 | 0.803 | 0.727 |
| 2002 | 0.762 | 0.773 | 0.947 | 1.051 | 1.035 | 1.019 | 1.069 | 1.083 | 1.073 | 1.124 | 1.071 | 1.031 |
| 2003 | 1.092 | 1.260 | 1.276 | 1.154 | 1.122 | 1.135 | 1.151 | 1.279 | 1.230 | 1.166 | 1.088 | 1.055 |
| 2004 | 1.179 | 1.283 | 1.349 | 1.420 | 1.607 | 1.542 | 1.507 | 1.508 | 1.496 | 1.583 | 1.534 | 1.416 |
| 2005 | 1.437 | 1.529 | 1.703 | 1.779 | 1.704 | 1.730 | 1.852 | 2.116 | 2.455 | 2.162 | 1.788 | 1.783 |
| 2006 | 1.854 | 1.837 | 2.006 | 2.300 | 2.390 | 2.415 | 2.553 | 2.569 | 1.993 | 1.812 | 1.826 | 1.859 |
| 2007 | 1.743 | 1.839 | 2.160 | 2.386 | 2.778 | 2.654 | 2.717 | 2.582 | 2.636 | 2.453 | 2.720 | 2.586 |
| 2008 | 2.600 | 2.648 | 2.813 | 2.984 | 3.327 | 3.541 | 3.548 | 3.327 | 3.260 | 2.468 | 1.667 | 1.299 |
| 2009 | 1.416 | 1.509 | 1.571 | 1.654 | 1.891 | 2.252 | 2.116 | 2.227 | 2.170 | 2.162 | 2.277 | 2.234 |
| 2010 | 2.350 | 2.297 | 2.430 | 2.519 | 2.470 | 2.363 | 2.345 | 2.359 | 2.387 | 2.475 | 2.501 | 2.591 |
| 2011 | 2.736 | 2.810 | - | - | - | - | - | - | - | - | - | - |
| 2012 | - | - | - | - | - | - | - | - | - | - | - | - |
| 2013 | - | - | - | - | - | - | - | - | - | - | - | - |
| 2014 | - | - | - | - | - | - | - | - | - | - | - | - |
| 2015 | - | - | - | - | - | - | - | - | - | - | - | - |
| 2016 | - | - | - | - | - | - | - | - | - | - | - | - |
| 2017 | - | - | - | - | - | - | - | - | - | - | - | - |
| 2018 | - | - | - | - | - | - | - | - | - | - | - | - |
| 2019 | - | - | - | - | - | - | - | - | - | - | - | - |
| 2020 | - | - | - | - | - | - | - | - | - | - | - | - |
| 2021 | - | - | - | - | - | - | - | - | - | - | - | - |
| 2022 | - | - | - | |||||||||
| - = No Data Reported; -- = Not Applicable; NA = Not Available; W = Withheld to avoid disclosure of individual company data. |
| Release Date: 6/1/2022 |
| Next Release Date: TBD |