|
Download Data (XLS File) |
|
||||||||
|
||||||||
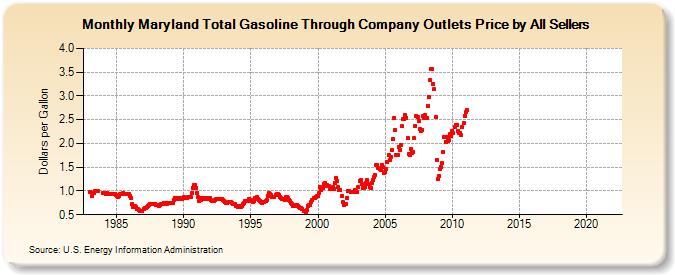
| Maryland Total Gasoline Through Company Outlets Price by All Sellers (Dollars per Gallon) | ||||||||
| Year | Jan | Feb | Mar | Apr | May | Jun | Jul | Aug | Sep | Oct | Nov | Dec |
|---|---|---|---|---|---|---|---|---|---|---|---|---|
| 1983 | 0.984 | W | 0.894 | 0.950 | 0.955 | 0.990 | 1.006 | 0.993 | W | W | W | W |
| 1984 | 0.960 | 0.955 | 0.945 | 0.951 | 0.946 | 0.940 | 0.940 | 0.926 | 0.928 | 0.926 | 0.926 | 0.920 |
| 1985 | 0.889 | 0.873 | 0.904 | 0.933 | 0.938 | 0.946 | 0.955 | 0.938 | 0.936 | 0.933 | 0.944 | 0.936 |
| 1986 | 0.889 | 0.847 | 0.723 | 0.664 | 0.677 | 0.667 | 0.610 | 0.614 | 0.589 | 0.579 | 0.574 | 0.574 |
| 1987 | 0.617 | 0.633 | 0.642 | 0.657 | 0.673 | 0.713 | 0.727 | 0.734 | 0.731 | 0.728 | 0.720 | 0.708 |
| 1988 | 0.696 | 0.697 | 0.688 | 0.711 | 0.721 | 0.727 | 0.748 | 0.747 | 0.736 | 0.734 | 0.745 | 0.745 |
| 1989 | 0.746 | 0.739 | 0.747 | 0.817 | 0.856 | 0.861 | 0.855 | 0.838 | 0.843 | 0.845 | 0.840 | 0.846 |
| 1990 | 0.869 | 0.860 | 0.845 | 0.860 | 0.873 | 0.873 | 0.871 | 0.966 | 1.065 | 1.126 | 1.134 | 1.059 |
| 1991 | 0.963 | 0.863 | 0.793 | 0.806 | 0.857 | 0.860 | 0.839 | 0.859 | 0.852 | 0.840 | 0.853 | 0.848 |
| 1992 | 0.815 | 0.795 | 0.782 | 0.789 | 0.816 | 0.841 | 0.840 | 0.836 | 0.832 | 0.833 | 0.837 | 0.818 |
| 1993 | 0.795 | 0.768 | 0.755 | 0.752 | 0.771 | 0.773 | 0.765 | 0.756 | 0.726 | 0.720 | 0.717 | 0.687 |
| 1994 | 0.667 | 0.676 | 0.660 | 0.670 | 0.690 | 0.717 | 0.749 | 0.789 | 0.790 | 0.787 | 0.831 | 0.802 |
| 1995 | 0.802 | 0.788 | 0.760 | 0.788 | 0.856 | 0.869 | 0.839 | 0.809 | 0.791 | 0.764 | 0.744 | 0.759 |
| 1996 | 0.776 | 0.779 | 0.812 | 0.902 | 0.950 | 0.927 | 0.912 | 0.881 | 0.875 | 0.882 | 0.916 | 0.934 |
| 1997 | 0.933 | 0.906 | 0.878 | 0.844 | 0.833 | 0.823 | 0.820 | 0.869 | 0.876 | 0.847 | 0.818 | 0.786 |
| 1998 | 0.754 | 0.721 | 0.685 | 0.684 | 0.702 | 0.704 | 0.693 | 0.664 | 0.646 | 0.649 | 0.622 | 0.573 |
| 1999 | 0.571 | 0.554 | 0.598 | 0.685 | 0.704 | 0.706 | 0.761 | 0.811 | 0.849 | 0.855 | 0.873 | 0.891 |
| 2000 | 0.895 | 0.962 | 1.079 | 1.013 | 1.060 | 1.151 | 1.169 | 1.098 | 1.116 | 1.096 | 1.095 | 1.038 |
| 2001 | 1.067 | 1.080 | 1.039 | 1.168 | 1.274 | 1.215 | 1.076 | 1.013 | 1.016 | 0.889 | 0.760 | 0.698 |
| 2002 | 0.721 | 0.720 | 0.858 | 1.007 | 0.999 | 0.982 | 0.985 | 0.983 | 0.986 | 1.019 | 0.994 | 0.987 |
| 2003 | 1.076 | 1.207 | 1.231 | 1.153 | 1.064 | 1.053 | 1.078 | 1.177 | 1.223 | 1.144 | 1.078 | 1.055 |
| 2004 | 1.177 | 1.240 | 1.293 | 1.331 | 1.543 | 1.543 | 1.481 | 1.455 | 1.440 | 1.549 | 1.503 | 1.375 |
| 2005 | 1.392 | 1.460 | 1.603 | 1.754 | 1.657 | 1.721 | 1.857 | 2.087 | 2.544 | 2.280 | 1.767 | 1.760 |
| 2006 | 1.924 | 1.870 | 1.967 | 2.365 | 2.514 | 2.505 | 2.589 | 2.541 | 2.104 | 1.770 | 1.763 | 1.885 |
| 2007 | 1.804 | 1.810 | 2.108 | 2.371 | 2.573 | 2.552 | 2.471 | 2.303 | 2.259 | 2.293 | 2.582 | 2.537 |
| 2008 | 2.590 | 2.541 | 2.787 | 2.969 | 3.325 | 3.571 | 3.558 | 3.249 | 3.139 | 2.555 | 1.658 | 1.255 |
| 2009 | 1.306 | 1.461 | 1.500 | 1.589 | 1.829 | 2.126 | 2.039 | 2.128 | 2.059 | 2.063 | 2.190 | 2.154 |
| 2010 | 2.264 | 2.219 | 2.337 | 2.395 | 2.396 | 2.255 | 2.228 | 2.224 | 2.176 | 2.336 | 2.420 | 2.573 |
| 2011 | 2.661 | 2.704 | - | - | - | - | - | - | - | - | - | - |
| 2012 | - | - | - | - | - | - | - | - | - | - | - | - |
| 2013 | - | - | - | - | - | - | - | - | - | - | - | - |
| 2014 | - | - | - | - | - | - | - | - | - | - | - | - |
| 2015 | - | - | - | - | - | - | - | - | - | - | - | - |
| 2016 | - | - | - | - | - | - | - | - | - | - | - | - |
| 2017 | - | - | - | - | - | - | - | - | - | - | - | - |
| 2018 | - | - | - | - | - | - | - | - | - | - | - | - |
| 2019 | - | - | - | - | - | - | - | - | - | - | - | - |
| 2020 | - | - | - | - | - | - | - | - | - | - | - | - |
| 2021 | - | - | - | - | - | - | - | - | - | - | - | - |
| 2022 | - | - | - | |||||||||
| - = No Data Reported; -- = Not Applicable; NA = Not Available; W = Withheld to avoid disclosure of individual company data. |
| Release Date: 6/1/2022 |
| Next Release Date: TBD |