|
Download Data (XLS File) |
|
||||||||
|
||||||||
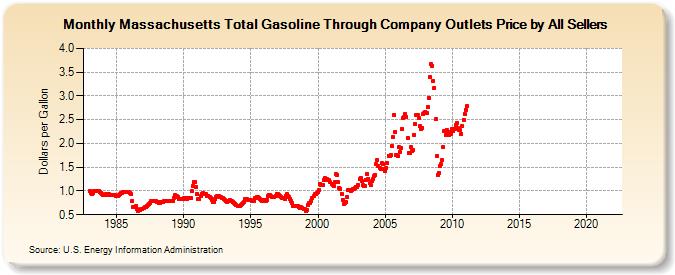
| Massachusetts Total Gasoline Through Company Outlets Price by All Sellers (Dollars per Gallon) | ||||||||
| Year | Jan | Feb | Mar | Apr | May | Jun | Jul | Aug | Sep | Oct | Nov | Dec |
|---|---|---|---|---|---|---|---|---|---|---|---|---|
| 1983 | 1.004 | 0.967 | 0.929 | 0.956 | 0.990 | 0.994 | 1.002 | 1.001 | 0.994 | 0.977 | 0.958 | 0.937 |
| 1984 | 0.921 | 0.920 | 0.931 | 0.925 | 0.938 | 0.929 | 0.917 | 0.909 | 0.919 | 0.918 | 0.910 | 0.900 |
| 1985 | 0.895 | 0.889 | 0.905 | 0.928 | 0.954 | 0.967 | 0.979 | 0.978 | 0.970 | 0.974 | 0.974 | 0.976 |
| 1986 | 0.958 | 0.926 | 0.792 | 0.666 | 0.666 | 0.678 | 0.616 | 0.587 | 0.592 | 0.607 | 0.613 | 0.617 |
| 1987 | 0.640 | 0.655 | 0.670 | 0.684 | 0.700 | 0.732 | 0.756 | 0.782 | 0.785 | 0.781 | 0.787 | 0.784 |
| 1988 | 0.776 | 0.765 | 0.749 | 0.750 | 0.762 | 0.765 | 0.781 | 0.792 | 0.786 | 0.786 | 0.791 | 0.794 |
| 1989 | 0.792 | 0.789 | 0.796 | 0.855 | 0.905 | 0.903 | 0.892 | 0.865 | 0.838 | 0.821 | 0.828 | 0.825 |
| 1990 | 0.851 | 0.845 | 0.829 | 0.830 | 0.842 | 0.848 | 0.846 | 0.990 | 1.105 | 1.190 | 1.189 | 1.090 |
| 1991 | 0.934 | 0.830 | 0.831 | 0.895 | 0.946 | 0.956 | 0.934 | 0.936 | 0.926 | 0.899 | 0.901 | 0.878 |
| 1992 | 0.847 | 0.813 | 0.775 | 0.775 | 0.828 | 0.882 | 0.895 | 0.884 | 0.873 | 0.868 | 0.860 | 0.847 |
| 1993 | 0.826 | 0.803 | 0.788 | 0.776 | 0.796 | 0.806 | 0.792 | 0.782 | 0.763 | 0.752 | 0.734 | 0.702 |
| 1994 | 0.688 | 0.693 | 0.691 | 0.698 | 0.716 | 0.743 | 0.777 | 0.829 | 0.826 | 0.816 | 0.819 | 0.810 |
| 1995 | 0.803 | 0.797 | 0.785 | 0.796 | 0.851 | 0.873 | 0.863 | 0.849 | 0.837 | 0.820 | 0.787 | 0.794 |
| 1996 | 0.803 | 0.794 | 0.810 | 0.885 | 0.923 | 0.908 | 0.888 | 0.873 | 0.869 | 0.875 | 0.904 | 0.937 |
| 1997 | 0.936 | 0.922 | 0.891 | 0.873 | 0.855 | 0.851 | 0.840 | 0.903 | 0.926 | 0.903 | 0.873 | 0.836 |
| 1998 | 0.790 | 0.746 | 0.691 | 0.677 | 0.683 | 0.682 | 0.675 | 0.659 | 0.642 | 0.656 | 0.650 | 0.630 |
| 1999 | 0.613 | 0.587 | 0.605 | 0.711 | 0.740 | 0.738 | 0.785 | 0.854 | 0.896 | 0.930 | 0.938 | 0.961 |
| 2000 | 0.976 | 1.022 | 1.149 | 1.126 | 1.129 | 1.235 | 1.268 | 1.238 | 1.244 | 1.228 | 1.223 | 1.182 |
| 2001 | 1.148 | 1.128 | 1.095 | 1.185 | 1.353 | 1.339 | 1.184 | 1.069 | 1.041 | 0.942 | 0.810 | 0.720 |
| 2002 | 0.750 | 0.758 | 0.875 | 1.015 | 1.021 | 1.002 | 1.011 | 1.048 | 1.049 | 1.059 | 1.087 | 1.088 |
| 2003 | 1.124 | 1.248 | 1.282 | 1.215 | 1.126 | 1.106 | 1.113 | 1.231 | 1.359 | 1.256 | 1.158 | 1.122 |
| 2004 | 1.200 | 1.262 | 1.309 | 1.329 | 1.572 | 1.642 | 1.532 | 1.493 | 1.470 | 1.588 | 1.574 | 1.464 |
| 2005 | 1.414 | 1.478 | 1.580 | 1.746 | 1.730 | 1.757 | 1.941 | 2.138 | 2.604 | 2.246 | 1.765 | 1.736 |
| 2006 | 1.917 | 1.830 | 1.914 | 2.312 | 2.531 | 2.551 | 2.624 | 2.559 | 2.123 | 1.802 | 1.794 | 1.923 |
| 2007 | 1.851 | 1.865 | 2.183 | 2.404 | 2.605 | 2.591 | 2.525 | 2.360 | 2.303 | 2.333 | 2.626 | 2.646 |
| 2008 | 2.669 | 2.644 | 2.763 | 2.962 | 3.395 | 3.669 | 3.639 | 3.319 | 3.169 | 2.505 | 1.738 | 1.345 |
| 2009 | 1.383 | 1.532 | 1.558 | 1.649 | 1.925 | 2.260 | 2.182 | 2.283 | 2.231 | 2.177 | 2.234 | 2.205 |
| 2010 | 2.294 | 2.257 | 2.314 | 2.391 | 2.434 | 2.322 | 2.291 | 2.276 | 2.202 | 2.369 | 2.502 | 2.628 |
| 2011 | 2.710 | 2.778 | - | - | - | - | - | - | - | - | - | - |
| 2012 | - | - | - | - | - | - | - | - | - | - | - | - |
| 2013 | - | - | - | - | - | - | - | - | - | - | - | - |
| 2014 | - | - | - | - | - | - | - | - | - | - | - | - |
| 2015 | - | - | - | - | - | - | - | - | - | - | - | - |
| 2016 | - | - | - | - | - | - | - | - | - | - | - | - |
| 2017 | - | - | - | - | - | - | - | - | - | - | - | - |
| 2018 | - | - | - | - | - | - | - | - | - | - | - | - |
| 2019 | - | - | - | - | - | - | - | - | - | - | - | - |
| 2020 | - | - | - | - | - | - | - | - | - | - | - | - |
| 2021 | - | - | - | - | - | - | - | - | - | - | - | - |
| 2022 | - | - | - | |||||||||
| - = No Data Reported; -- = Not Applicable; NA = Not Available; W = Withheld to avoid disclosure of individual company data. |
| Release Date: 6/1/2022 |
| Next Release Date: TBD |