|
Download Data (XLS File) |
|
||||||||
|
||||||||
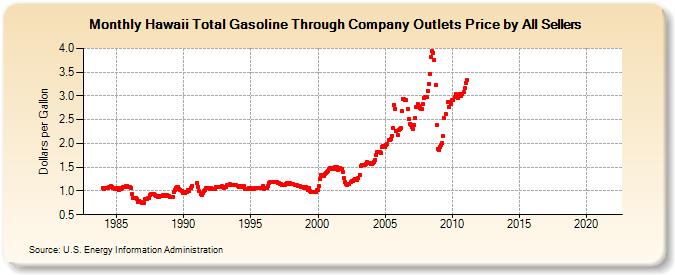
| Hawaii Total Gasoline Through Company Outlets Price by All Sellers (Dollars per Gallon) | ||||||||
| Year | Jan | Feb | Mar | Apr | May | Jun | Jul | Aug | Sep | Oct | Nov | Dec |
|---|---|---|---|---|---|---|---|---|---|---|---|---|
| 1983 | W | W | W | W | W | W | W | W | W | W | W | W |
| 1984 | 1.055 | 1.034 | 1.052 | 1.056 | 1.068 | 1.077 | 1.075 | 1.096 | 1.087 | 1.064 | 1.050 | 1.041 |
| 1985 | 1.057 | 1.068 | 1.027 | 1.037 | 1.039 | 1.069 | 1.083 | 1.085 | 1.098 | 1.114 | 1.080 | 1.073 |
| 1986 | 1.085 | 1.062 | 0.945 | 0.847 | 0.856 | 0.862 | 0.821 | 0.772 | 0.798 | 0.778 | 0.762 | 0.746 |
| 1987 | 0.751 | 0.831 | 0.834 | 0.830 | 0.860 | 0.846 | 0.907 | 0.935 | 0.933 | 0.933 | 0.915 | 0.904 |
| 1988 | 0.890 | 0.876 | 0.874 | 0.891 | 0.900 | 0.907 | 0.911 | 0.898 | 0.904 | 0.905 | 0.897 | 0.889 |
| 1989 | 0.869 | 0.873 | 0.878 | 0.981 | 1.030 | 1.070 | 1.087 | 1.086 | 1.045 | 1.024 | 0.996 | 0.947 |
| 1990 | 0.955 | 0.962 | 0.969 | 0.978 | 1.019 | 1.007 | 1.053 | 1.097 | W | W | W | W |
| 1991 | 1.166 | 1.087 | 0.991 | 0.930 | 0.918 | 0.959 | 0.995 | 1.018 | 1.055 | 1.068 | 1.070 | 1.039 |
| 1992 | 1.058 | 1.049 | 1.042 | 1.040 | 1.047 | 1.083 | 1.090 | 1.089 | 1.089 | 1.090 | 1.097 | 1.086 |
| 1993 | 1.072 | 1.078 | 1.086 | 1.134 | 1.135 | 1.137 | 1.135 | 1.122 | 1.121 | 1.125 | 1.125 | 1.115 |
| 1994 | 1.100 | 1.091 | 1.098 | 1.104 | 1.088 | 1.089 | 1.101 | 1.042 | 1.043 | 1.048 | 1.054 | 1.053 |
| 1995 | 1.053 | 1.050 | 1.049 | 1.051 | 1.055 | 1.059 | 1.059 | 1.070 | 1.059 | 1.060 | 1.058 | 1.101 |
| 1996 | 1.048 | 1.058 | 1.057 | 1.098 | 1.171 | 1.186 | 1.191 | 1.197 | 1.193 | 1.193 | 1.189 | 1.181 |
| 1997 | 1.171 | 1.167 | 1.151 | 1.136 | 1.125 | 1.122 | 1.134 | 1.139 | 1.157 | 1.162 | 1.152 | 1.161 |
| 1998 | 1.152 | 1.148 | 1.139 | 1.129 | 1.123 | 1.115 | 1.111 | 1.105 | 1.098 | 1.086 | 1.074 | 1.071 |
| 1999 | 1.093 | 1.081 | 1.067 | 1.013 | 1.060 | 0.995 | 0.979 | 0.981 | 0.979 | 0.981 | 0.983 | 1.016 |
| 2000 | 1.024 | 1.095 | 1.256 | 1.332 | 1.322 | 1.309 | 1.359 | 1.375 | 1.396 | 1.423 | 1.469 | 1.480 |
| 2001 | 1.478 | 1.471 | 1.463 | 1.500 | 1.506 | 1.499 | 1.449 | 1.491 | 1.489 | 1.467 | 1.405 | 1.282 |
| 2002 | 1.187 | 1.145 | 1.122 | 1.143 | 1.152 | 1.181 | 1.211 | 1.219 | 1.228 | 1.258 | 1.257 | 1.237 |
| 2003 | 1.264 | 1.337 | 1.519 | 1.556 | 1.552 | 1.546 | 1.551 | 1.575 | 1.610 | 1.596 | 1.586 | 1.564 |
| 2004 | 1.569 | 1.581 | 1.616 | 1.656 | 1.755 | 1.820 | 1.823 | 1.827 | 1.806 | 1.916 | 1.941 | 1.928 |
| 2005 | 1.935 | 1.959 | 1.979 | 2.064 | 2.067 | 2.093 | 2.157 | 2.324 | 2.815 | 2.731 | 2.271 | 2.181 |
| 2006 | 2.286 | 2.306 | 2.323 | 2.675 | 2.935 | 2.932 | 2.922 | 2.909 | 2.733 | 2.508 | 2.411 | 2.383 |
| 2007 | 2.342 | 2.302 | 2.381 | 2.533 | 2.777 | 2.835 | 2.782 | 2.754 | 2.718 | 2.724 | 2.833 | 2.946 |
| 2008 | 2.972 | 2.984 | 3.109 | 3.255 | 3.462 | 3.821 | 3.954 | 3.912 | 3.764 | 3.228 | 2.386 | 1.890 |
| 2009 | 1.856 | 1.934 | 1.963 | 2.001 | 2.146 | 2.525 | 2.621 | NA | 2.863 | 2.759 | 2.865 | 2.839 |
| 2010 | 2.917 | 2.921 | 2.970 | 3.047 | 3.021 | 2.954 | 3.021 | 3.049 | 2.995 | 3.043 | 3.081 | 3.159 |
| 2011 | 3.272 | 3.325 | - | - | - | - | - | - | - | - | - | - |
| 2012 | - | - | - | - | - | - | - | - | - | - | - | - |
| 2013 | - | - | - | - | - | - | - | - | - | - | - | - |
| 2014 | - | - | - | - | - | - | - | - | - | - | - | - |
| 2015 | - | - | - | - | - | - | - | - | - | - | - | - |
| 2016 | - | - | - | - | - | - | - | - | - | - | - | - |
| 2017 | - | - | - | - | - | - | - | - | - | - | - | - |
| 2018 | - | - | - | - | - | - | - | - | - | - | - | - |
| 2019 | - | - | - | - | - | - | - | - | - | - | - | - |
| 2020 | - | - | - | - | - | - | - | - | - | - | - | - |
| 2021 | - | - | - | - | - | - | - | - | - | - | - | - |
| 2022 | - | - | - | |||||||||
| - = No Data Reported; -- = Not Applicable; NA = Not Available; W = Withheld to avoid disclosure of individual company data. |
| Release Date: 6/1/2022 |
| Next Release Date: TBD |