|
Download Data (XLS File) |
|
||||||||
|
||||||||
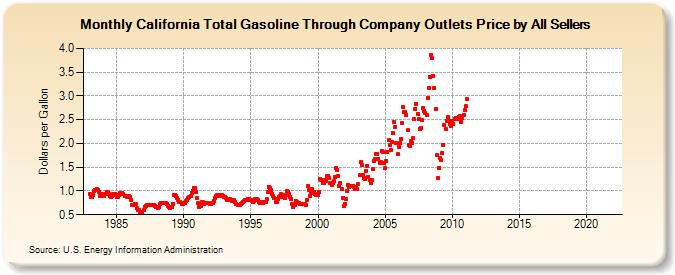
| California Total Gasoline Through Company Outlets Price by All Sellers (Dollars per Gallon) | ||||||||
| Year | Jan | Feb | Mar | Apr | May | Jun | Jul | Aug | Sep | Oct | Nov | Dec |
|---|---|---|---|---|---|---|---|---|---|---|---|---|
| 1983 | 0.945 | 0.879 | 0.867 | 0.923 | 1.002 | 1.023 | 1.043 | 1.023 | 0.970 | 0.904 | 0.909 | 0.932 |
| 1984 | 0.918 | 0.900 | 0.941 | 0.982 | 0.988 | 0.942 | 0.888 | 0.873 | 0.895 | 0.936 | 0.944 | 0.914 |
| 1985 | 0.881 | 0.870 | 0.915 | 0.956 | 0.967 | 0.961 | 0.929 | 0.896 | 0.888 | 0.873 | 0.873 | 0.884 |
| 1986 | 0.865 | 0.801 | 0.706 | 0.700 | 0.735 | 0.723 | 0.632 | 0.591 | 0.600 | 0.552 | 0.534 | 0.545 |
| 1987 | 0.592 | 0.672 | 0.689 | 0.701 | 0.712 | 0.708 | 0.696 | 0.711 | 0.708 | 0.709 | 0.682 | 0.664 |
| 1988 | 0.666 | 0.650 | 0.655 | 0.716 | 0.737 | 0.746 | 0.748 | 0.750 | 0.756 | 0.726 | 0.683 | 0.658 |
| 1989 | 0.637 | 0.652 | 0.727 | 0.906 | 0.910 | 0.890 | 0.855 | 0.802 | 0.773 | 0.766 | 0.734 | 0.723 |
| 1990 | 0.747 | 0.756 | 0.779 | 0.806 | 0.852 | 0.873 | 0.897 | 0.961 | 1.002 | 1.071 | 1.062 | 0.976 |
| 1991 | 0.854 | 0.747 | 0.653 | 0.684 | 0.762 | 0.764 | 0.724 | 0.743 | 0.756 | 0.742 | 0.736 | 0.726 |
| 1992 | 0.733 | 0.742 | 0.742 | 0.784 | 0.858 | 0.901 | 0.918 | 0.909 | 0.896 | 0.902 | 0.915 | 0.893 |
| 1993 | 0.880 | 0.867 | 0.842 | 0.817 | 0.820 | 0.825 | 0.815 | 0.798 | 0.795 | 0.813 | 0.767 | 0.721 |
| 1994 | 0.703 | 0.695 | 0.703 | 0.720 | 0.737 | 0.758 | 0.786 | 0.803 | 0.804 | 0.823 | 0.825 | 0.808 |
| 1995 | 0.815 | 0.787 | 0.776 | 0.789 | 0.825 | 0.826 | 0.801 | 0.770 | 0.746 | 0.767 | 0.767 | 0.752 |
| 1996 | 0.760 | 0.772 | 0.826 | 0.971 | 1.092 | 1.056 | 1.015 | 0.946 | 0.884 | 0.843 | 0.777 | 0.776 |
| 1997 | 0.828 | 0.869 | 0.892 | 0.936 | 0.919 | 0.874 | 0.848 | 0.914 | 0.997 | 0.984 | 0.932 | 0.883 |
| 1998 | 0.828 | 0.730 | 0.665 | 0.705 | 0.790 | 0.769 | 0.750 | 0.743 | 0.727 | 0.724 | 0.720 | 0.716 |
| 1999 | 0.722 | 0.709 | 0.806 | 1.114 | 1.010 | 0.893 | 0.949 | 1.048 | 0.980 | 0.931 | 0.919 | 0.939 |
| 2000 | 0.921 | 0.986 | 1.256 | 1.239 | 1.159 | 1.166 | 1.234 | 1.200 | 1.322 | 1.311 | 1.274 | 1.174 |
| 2001 | 1.119 | 1.158 | 1.206 | 1.296 | 1.478 | 1.450 | 1.306 | 1.112 | 1.163 | 1.035 | 0.854 | 0.673 |
| 2002 | 0.725 | 0.829 | 1.009 | 1.123 | 1.087 | 1.106 | 1.107 | 1.101 | 1.083 | 1.042 | 1.090 | 1.039 |
| 2003 | 1.136 | 1.331 | 1.599 | 1.543 | 1.342 | 1.274 | 1.254 | 1.420 | 1.521 | 1.304 | 1.225 | 1.173 |
| 2004 | 1.237 | 1.466 | 1.640 | 1.670 | 1.787 | 1.781 | 1.680 | 1.595 | 1.607 | 1.842 | 1.816 | 1.580 |
| 2005 | 1.477 | 1.626 | 1.825 | 2.065 | 1.957 | 1.872 | 2.036 | 2.213 | 2.455 | 2.348 | 2.011 | 1.768 |
| 2006 | 1.920 | 2.001 | 2.095 | 2.433 | 2.772 | 2.654 | 2.659 | 2.597 | 2.279 | 1.966 | 1.952 | 2.046 |
| 2007 | 2.003 | 2.124 | 2.512 | 2.725 | 2.833 | 2.615 | 2.514 | 2.307 | 2.326 | 2.489 | 2.753 | 2.673 |
| 2008 | 2.630 | 2.604 | 2.961 | 3.177 | 3.407 | 3.868 | 3.788 | 3.427 | 3.162 | 2.726 | 1.765 | 1.277 |
| 2009 | 1.492 | 1.695 | 1.648 | 1.790 | 1.977 | 2.380 | 2.296 | 2.477 | 2.555 | 2.472 | 2.402 | 2.375 |
| 2010 | 2.468 | 2.404 | 2.517 | 2.542 | 2.529 | 2.516 | 2.566 | 2.571 | 2.460 | 2.545 | 2.595 | 2.699 |
| 2011 | 2.779 | 2.942 | - | - | - | - | - | - | - | - | - | - |
| 2012 | - | - | - | - | - | - | - | - | - | - | - | - |
| 2013 | - | - | - | - | - | - | - | - | - | - | - | - |
| 2014 | - | - | - | - | - | - | - | - | - | - | - | - |
| 2015 | - | - | - | - | - | - | - | - | - | - | - | - |
| 2016 | - | - | - | - | - | - | - | - | - | - | - | - |
| 2017 | - | - | - | - | - | - | - | - | - | - | - | - |
| 2018 | - | - | - | - | - | - | - | - | - | - | - | - |
| 2019 | - | - | - | - | - | - | - | - | - | - | - | - |
| 2020 | - | - | - | - | - | - | - | - | - | - | - | - |
| 2021 | - | - | - | - | - | - | - | - | - | - | - | - |
| 2022 | - | - | - | |||||||||
| - = No Data Reported; -- = Not Applicable; NA = Not Available; W = Withheld to avoid disclosure of individual company data. |
| Release Date: 6/1/2022 |
| Next Release Date: TBD |