|
Download Data (XLS File) |
|
||||||||
|
||||||||
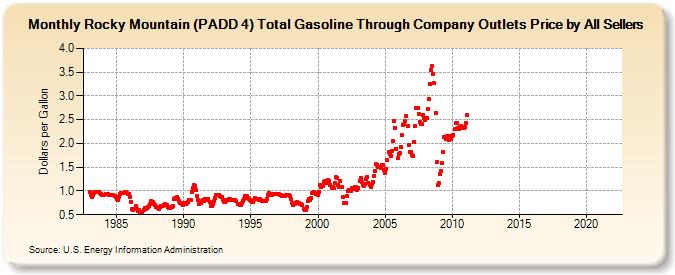
| Rocky Mountain (PADD 4) Total Gasoline Through Company Outlets Price by All Sellers (Dollars per Gallon) | ||||||||
| Year | Jan | Feb | Mar | Apr | May | Jun | Jul | Aug | Sep | Oct | Nov | Dec |
|---|---|---|---|---|---|---|---|---|---|---|---|---|
| 1983 | 0.978 | 0.908 | 0.876 | 0.914 | 0.957 | 0.983 | 0.977 | 0.988 | 0.974 | 0.965 | 0.934 | 0.917 |
| 1984 | 0.914 | 0.925 | 0.935 | 0.934 | 0.931 | 0.920 | 0.911 | 0.907 | 0.910 | 0.907 | 0.904 | 0.882 |
| 1985 | 0.839 | 0.814 | 0.871 | 0.945 | 0.954 | 0.962 | 0.963 | 0.979 | 0.974 | 0.962 | 0.945 | 0.928 |
| 1986 | 0.881 | 0.771 | 0.612 | 0.606 | 0.629 | 0.678 | 0.612 | 0.588 | 0.594 | 0.553 | 0.563 | 0.559 |
| 1987 | 0.594 | 0.632 | 0.627 | 0.646 | 0.655 | 0.692 | 0.719 | 0.789 | 0.767 | 0.733 | 0.710 | 0.671 |
| 1988 | 0.657 | 0.633 | 0.622 | 0.657 | 0.689 | 0.689 | 0.700 | 0.726 | 0.713 | 0.697 | 0.663 | 0.633 |
| 1989 | 0.639 | 0.658 | 0.689 | 0.821 | 0.854 | 0.856 | 0.877 | 0.832 | 0.791 | 0.748 | 0.717 | 0.709 |
| 1990 | 0.739 | 0.718 | 0.715 | 0.741 | 0.759 | 0.805 | 0.805 | 0.979 | 1.060 | 1.130 | 1.107 | 1.020 |
| 1991 | 0.898 | 0.801 | 0.718 | 0.749 | 0.787 | 0.806 | 0.788 | 0.829 | 0.838 | 0.810 | 0.832 | 0.768 |
| 1992 | 0.683 | 0.687 | 0.733 | 0.793 | 0.853 | 0.909 | 0.918 | 0.908 | 0.896 | 0.871 | 0.868 | 0.815 |
| 1993 | 0.778 | 0.773 | 0.782 | 0.809 | 0.832 | 0.824 | 0.807 | 0.806 | 0.804 | 0.817 | 0.815 | 0.780 |
| 1994 | 0.719 | 0.720 | 0.710 | 0.710 | 0.744 | 0.798 | 0.831 | 0.886 | 0.892 | 0.851 | 0.836 | 0.810 |
| 1995 | 0.787 | 0.769 | 0.771 | 0.803 | 0.844 | 0.838 | 0.824 | 0.811 | 0.822 | 0.803 | 0.799 | 0.784 |
| 1996 | 0.786 | 0.793 | 0.829 | 0.909 | 0.966 | 0.939 | 0.920 | 0.923 | 0.929 | 0.932 | 0.943 | 0.926 |
| 1997 | 0.927 | 0.926 | 0.906 | 0.908 | 0.899 | 0.900 | 0.892 | 0.918 | 0.920 | 0.919 | 0.914 | 0.892 |
| 1998 | 0.830 | 0.745 | 0.694 | 0.721 | 0.757 | 0.774 | 0.756 | 0.744 | 0.735 | 0.734 | 0.704 | 0.623 |
| 1999 | 0.598 | 0.605 | 0.661 | 0.782 | 0.827 | 0.809 | 0.862 | 0.947 | 0.983 | 0.962 | 0.940 | 0.936 |
| 2000 | 0.921 | 0.980 | 1.115 | 1.093 | 1.101 | 1.188 | 1.207 | 1.174 | 1.207 | 1.227 | 1.205 | 1.126 |
| 2001 | 1.068 | 1.081 | 1.060 | 1.166 | 1.304 | 1.270 | 1.128 | 1.086 | 1.202 | 1.076 | 0.871 | 0.746 |
| 2002 | 0.754 | 0.756 | 0.896 | 1.007 | 1.017 | 1.005 | 1.052 | 1.071 | 1.051 | 1.093 | 1.075 | 1.015 |
| 2003 | 1.070 | 1.209 | 1.277 | 1.194 | 1.116 | 1.107 | 1.139 | 1.256 | 1.285 | 1.176 | 1.135 | 1.089 |
| 2004 | 1.137 | 1.192 | 1.324 | 1.418 | 1.566 | 1.550 | 1.511 | 1.497 | 1.480 | 1.552 | 1.546 | 1.440 |
| 2005 | 1.384 | 1.457 | 1.643 | 1.814 | 1.778 | 1.743 | 1.850 | 2.042 | 2.475 | 2.330 | 1.883 | 1.688 |
| 2006 | 1.787 | 1.807 | 1.919 | 2.169 | 2.383 | 2.400 | 2.475 | 2.575 | 2.363 | 1.967 | 1.810 | 1.811 |
| 2007 | 1.750 | 1.746 | 2.032 | 2.364 | 2.756 | 2.745 | 2.628 | 2.447 | 2.409 | 2.401 | 2.608 | 2.525 |
| 2008 | 2.492 | 2.545 | 2.718 | 2.927 | 3.255 | 3.538 | 3.631 | 3.467 | 3.264 | 2.646 | 1.604 | 1.128 |
| 2009 | 1.158 | 1.354 | 1.425 | 1.591 | 1.826 | 2.131 | 2.096 | 2.156 | 2.128 | 2.076 | 2.153 | 2.084 |
| 2010 | 2.156 | 2.185 | 2.296 | 2.421 | 2.431 | 2.329 | 2.309 | 2.350 | 2.364 | 2.329 | 2.317 | 2.343 |
| 2011 | 2.439 | 2.596 | - | - | - | - | - | - | - | - | - | - |
| 2012 | - | - | - | - | - | - | - | - | - | - | - | - |
| 2013 | - | - | - | - | - | - | - | - | - | - | - | - |
| 2014 | - | - | - | - | - | - | - | - | - | - | - | - |
| 2015 | - | - | - | - | - | - | - | - | - | - | - | - |
| 2016 | - | - | - | - | - | - | - | - | - | - | - | - |
| 2017 | - | - | - | - | - | - | - | - | - | - | - | - |
| 2018 | - | - | - | - | - | - | - | - | - | - | - | - |
| 2019 | - | - | - | - | - | - | - | - | - | - | - | - |
| 2020 | - | - | - | - | - | - | - | - | - | - | - | - |
| 2021 | - | - | - | - | - | - | - | - | - | - | - | - |
| 2022 | - | - | - | |||||||||
| - = No Data Reported; -- = Not Applicable; NA = Not Available; W = Withheld to avoid disclosure of individual company data. |
| Release Date: 6/1/2022 |
| Next Release Date: TBD |