|
Download Data (XLS File) |
|
||||||||
|
||||||||
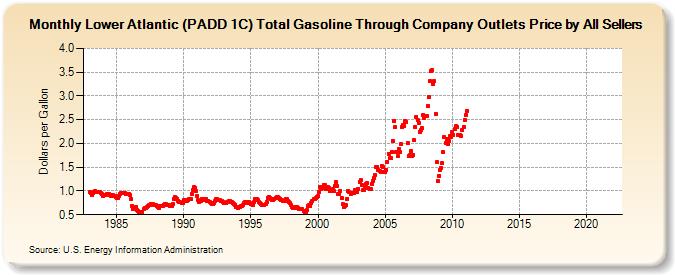
| Lower Atlantic (PADD 1C) Total Gasoline Through Company Outlets Price by All Sellers (Dollars per Gallon) | ||||||||
| Year | Jan | Feb | Mar | Apr | May | Jun | Jul | Aug | Sep | Oct | Nov | Dec |
|---|---|---|---|---|---|---|---|---|---|---|---|---|
| 1983 | 0.984 | 0.950 | 0.923 | 0.953 | 0.985 | 0.990 | 0.987 | 0.986 | 0.982 | 0.974 | 0.954 | 0.933 |
| 1984 | 0.904 | 0.914 | 0.920 | 0.932 | 0.943 | 0.942 | 0.919 | 0.904 | 0.903 | 0.905 | 0.894 | 0.875 |
| 1985 | 0.862 | 0.857 | 0.897 | 0.941 | 0.952 | 0.954 | 0.956 | 0.952 | 0.939 | 0.934 | 0.944 | 0.945 |
| 1986 | 0.906 | 0.832 | 0.687 | 0.624 | 0.651 | 0.659 | 0.600 | 0.575 | 0.567 | 0.555 | 0.553 | 0.564 |
| 1987 | 0.616 | 0.641 | 0.648 | 0.663 | 0.674 | 0.696 | 0.713 | 0.726 | 0.719 | 0.714 | 0.711 | 0.695 |
| 1988 | 0.678 | 0.659 | 0.649 | 0.676 | 0.690 | 0.689 | 0.712 | 0.721 | 0.720 | 0.711 | 0.708 | 0.697 |
| 1989 | 0.693 | 0.693 | 0.721 | 0.832 | 0.863 | 0.854 | 0.834 | 0.794 | 0.763 | 0.758 | 0.745 | 0.747 |
| 1990 | 0.815 | 0.803 | 0.787 | 0.799 | 0.816 | 0.826 | 0.821 | 0.933 | 1.011 | 1.082 | 1.070 | 0.995 |
| 1991 | 0.897 | 0.805 | 0.770 | 0.793 | 0.835 | 0.833 | 0.810 | 0.823 | 0.824 | 0.796 | 0.796 | 0.775 |
| 1992 | 0.739 | 0.720 | 0.717 | 0.747 | 0.793 | 0.825 | 0.823 | 0.811 | 0.803 | 0.792 | 0.790 | 0.769 |
| 1993 | 0.749 | 0.739 | 0.740 | 0.767 | 0.787 | 0.789 | 0.777 | 0.760 | 0.743 | 0.734 | 0.712 | 0.671 |
| 1994 | 0.645 | 0.659 | 0.662 | 0.679 | 0.689 | 0.712 | 0.739 | 0.774 | 0.769 | 0.755 | 0.764 | 0.748 |
| 1995 | 0.729 | 0.720 | 0.712 | 0.759 | 0.831 | 0.836 | 0.801 | 0.766 | 0.745 | 0.723 | 0.696 | 0.695 |
| 1996 | 0.712 | 0.718 | 0.766 | 0.849 | 0.880 | 0.857 | 0.839 | 0.817 | 0.814 | 0.826 | 0.860 | 0.867 |
| 1997 | 0.867 | 0.854 | 0.832 | 0.814 | 0.802 | 0.793 | 0.781 | 0.826 | 0.823 | 0.799 | 0.771 | 0.738 |
| 1998 | 0.698 | 0.663 | 0.640 | 0.648 | 0.663 | 0.660 | 0.649 | 0.625 | 0.612 | 0.627 | 0.611 | 0.568 |
| 1999 | 0.554 | 0.538 | 0.591 | 0.688 | 0.698 | 0.692 | 0.740 | 0.793 | 0.825 | 0.830 | 0.846 | 0.873 |
| 2000 | 0.885 | 0.969 | 1.090 | 1.031 | 1.056 | 1.127 | 1.120 | 1.048 | 1.088 | 1.077 | 1.059 | 0.996 |
| 2001 | 1.028 | 1.045 | 0.990 | 1.110 | 1.180 | 1.107 | 0.945 | 0.935 | 0.998 | 0.854 | 0.717 | 0.658 |
| 2002 | 0.691 | 0.696 | 0.838 | 0.992 | 0.974 | 0.946 | 0.950 | 0.953 | 0.960 | 1.030 | 1.008 | 0.975 |
| 2003 | 1.048 | 1.191 | 1.230 | 1.129 | 1.019 | 1.018 | 1.059 | 1.153 | 1.157 | 1.072 | 1.038 | 1.033 |
| 2004 | 1.154 | 1.213 | 1.283 | 1.341 | 1.498 | 1.500 | 1.445 | 1.415 | 1.409 | 1.535 | 1.514 | 1.390 |
| 2005 | 1.395 | 1.451 | 1.617 | 1.787 | 1.687 | 1.696 | 1.810 | 2.054 | 2.462 | 2.346 | 1.828 | 1.730 |
| 2006 | 1.890 | 1.820 | 1.982 | 2.349 | 2.378 | 2.368 | 2.481 | 2.456 | 2.013 | 1.727 | 1.747 | 1.841 |
| 2007 | 1.737 | 1.762 | 2.063 | 2.351 | 2.561 | 2.492 | 2.433 | 2.249 | 2.289 | 2.315 | 2.591 | 2.531 |
| 2008 | 2.583 | 2.586 | 2.795 | 2.974 | 3.308 | 3.523 | 3.538 | 3.243 | 3.304 | 2.621 | 1.599 | 1.204 |
| 2009 | 1.324 | 1.450 | 1.492 | 1.578 | 1.811 | 2.132 | 2.012 | 2.087 | 1.978 | 2.042 | 2.159 | 2.132 |
| 2010 | 2.247 | 2.176 | 2.304 | 2.359 | 2.348 | 2.183 | 2.170 | 2.184 | 2.165 | 2.280 | 2.341 | 2.497 |
| 2011 | 2.605 | 2.688 | - | - | - | - | - | - | - | - | - | - |
| 2012 | - | - | - | - | - | - | - | - | - | - | - | - |
| 2013 | - | - | - | - | - | - | - | - | - | - | - | - |
| 2014 | - | - | - | - | - | - | - | - | - | - | - | - |
| 2015 | - | - | - | - | - | - | - | - | - | - | - | - |
| 2016 | - | - | - | - | - | - | - | - | - | - | - | - |
| 2017 | - | - | - | - | - | - | - | - | - | - | - | - |
| 2018 | - | - | - | - | - | - | - | - | - | - | - | - |
| 2019 | - | - | - | - | - | - | - | - | - | - | - | - |
| 2020 | - | - | - | - | - | - | - | - | - | - | - | - |
| 2021 | - | - | - | - | - | - | - | - | - | - | - | - |
| 2022 | - | - | - | |||||||||
| - = No Data Reported; -- = Not Applicable; NA = Not Available; W = Withheld to avoid disclosure of individual company data. |
| Release Date: 6/1/2022 |
| Next Release Date: TBD |