|
Download Data (XLS File) |
|
||||||||
|
||||||||
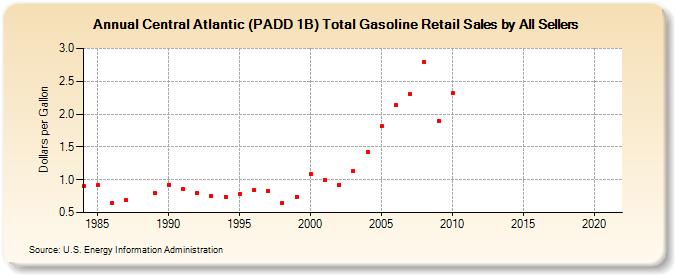
| Central Atlantic (PADD 1B) Total Gasoline Retail Sales by All Sellers (Dollars per Gallon) | ||||||||
| Decade | Year-0 | Year-1 | Year-2 | Year-3 | Year-4 | Year-5 | Year-6 | Year-7 | Year-8 | Year-9 |
|---|---|---|---|---|---|---|---|---|---|---|
| 1980's | 0.909 | 0.921 | 0.643 | 0.692 | 0.791 | |||||
| 1990's | 0.927 | 0.857 | 0.803 | 0.750 | 0.737 | 0.788 | 0.843 | 0.833 | 0.649 | 0.741 |
| 2000's | 1.090 | 0.994 | 0.926 | 1.134 | 1.428 | 1.812 | 2.133 | 2.308 | 2.791 | 1.900 |
| 2010's | 2.324 | - | - | - | - | - | - | - | - | - |
| 2020's | - |
| - = No Data Reported; -- = Not Applicable; NA = Not Available; W = Withheld to avoid disclosure of individual company data. |
| Release Date: 6/1/2022 |
| Next Release Date: TBD |