|
Download Data (XLS File) |
|
||||||||
|
||||||||
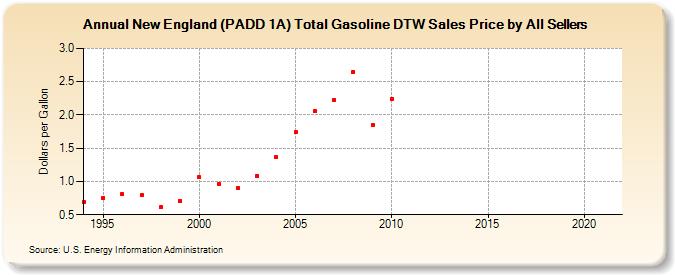
| New England (PADD 1A) Total Gasoline DTW Sales Price by All Sellers (Dollars per Gallon) | ||||||||
| Decade | Year-0 | Year-1 | Year-2 | Year-3 | Year-4 | Year-5 | Year-6 | Year-7 | Year-8 | Year-9 |
|---|---|---|---|---|---|---|---|---|---|---|
| 1990's | 0.688 | 0.757 | 0.814 | 0.800 | 0.610 | 0.710 | ||||
| 2000's | 1.066 | 0.968 | 0.905 | 1.088 | 1.363 | 1.736 | 2.055 | 2.230 | 2.648 | 1.849 |
| 2010's | 2.241 | - | - | - | - | - | - | - | - | - |
| 2020's | - |
| - = No Data Reported; -- = Not Applicable; NA = Not Available; W = Withheld to avoid disclosure of individual company data. |
| Release Date: 6/1/2022 |
| Next Release Date: TBD |