|
Download Data (XLS File) |
|
||||||||
|
||||||||
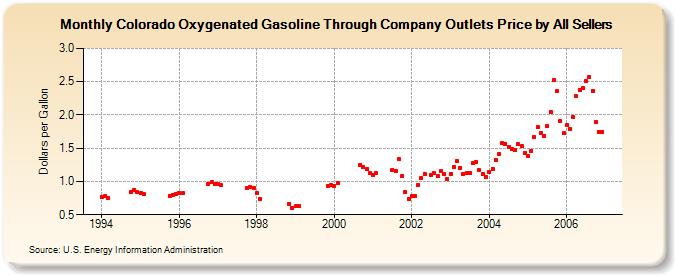
| Colorado Oxygenated Gasoline Through Company Outlets Price by All Sellers (Dollars per Gallon) | ||||||||
| Year | Jan | Feb | Mar | Apr | May | Jun | Jul | Aug | Sep | Oct | Nov | Dec |
|---|---|---|---|---|---|---|---|---|---|---|---|---|
| 1994 | 0.766 | 0.778 | 0.748 | W | W | W | W | W | W | 0.835 | 0.868 | 0.837 |
| 1995 | 0.824 | 0.807 | W | W | W | W | W | W | W | 0.784 | 0.797 | 0.817 |
| 1996 | 0.826 | 0.825 | NA | - | - | - | - | - | W | 0.964 | 0.989 | 0.965 |
| 1997 | 0.955 | 0.946 | W | W | W | W | W | W | W | 0.909 | 0.920 | 0.906 |
| 1998 | 0.832 | 0.737 | - | - | - | - | - | - | - | W | 0.668 | 0.608 |
| 1999 | 0.627 | 0.633 | NA | W | W | W | - | - | - | - | 0.935 | 0.940 |
| 2000 | 0.932 | 0.975 | W | W | W | W | W | W | 1.252 | 1.224 | 1.190 | 1.125 |
| 2001 | 1.100 | 1.124 | NA | NA | NA | NA | 1.173 | 1.158 | 1.332 | 1.085 | 0.844 | 0.735 |
| 2002 | 0.780 | 0.777 | 0.943 | 1.046 | 1.112 | NA | 1.102 | 1.120 | 1.082 | 1.157 | 1.109 | 1.033 |
| 2003 | 1.117 | 1.222 | 1.309 | 1.203 | 1.119 | 1.120 | 1.123 | 1.272 | 1.296 | 1.169 | 1.113 | 1.067 |
| 2004 | 1.142 | 1.190 | 1.320 | 1.414 | 1.574 | 1.567 | 1.519 | 1.495 | 1.471 | 1.559 | 1.532 | 1.428 |
| 2005 | 1.380 | 1.462 | 1.662 | 1.812 | 1.735 | 1.683 | 1.826 | 2.044 | 2.532 | 2.356 | 1.907 | 1.725 |
| 2006 | 1.842 | 1.795 | 1.963 | 2.278 | 2.378 | 2.402 | 2.510 | 2.576 | 2.362 | 1.901 | 1.750 | 1.748 |
| - = No Data Reported; -- = Not Applicable; NA = Not Available; W = Withheld to avoid disclosure of individual company data. |
| Release Date: 6/1/2022 |
| Next Release Date: TBD |