|
Download Data (XLS File) |
|
||||||||
|
||||||||
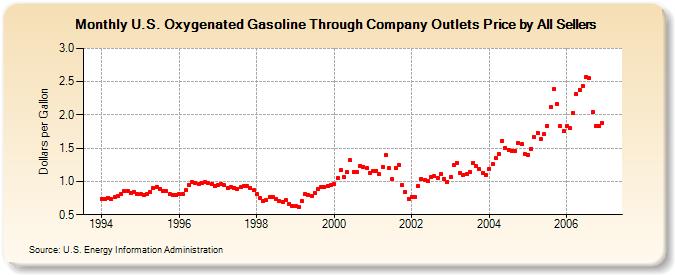
| U.S. Oxygenated Gasoline Through Company Outlets Price by All Sellers (Dollars per Gallon) | ||||||||
| Year | Jan | Feb | Mar | Apr | May | Jun | Jul | Aug | Sep | Oct | Nov | Dec |
|---|---|---|---|---|---|---|---|---|---|---|---|---|
| 1994 | 0.739 | 0.733 | 0.758 | 0.730 | 0.765 | 0.781 | 0.805 | 0.854 | 0.862 | 0.831 | 0.838 | 0.812 |
| 1995 | 0.804 | 0.796 | 0.804 | 0.848 | 0.899 | 0.921 | 0.885 | 0.849 | 0.856 | 0.808 | 0.792 | 0.793 |
| 1996 | 0.807 | 0.817 | 0.864 | 0.949 | 0.993 | 0.979 | 0.961 | 0.973 | 0.994 | 0.975 | 0.957 | 0.927 |
| 1997 | 0.944 | 0.961 | 0.942 | 0.902 | 0.915 | 0.907 | 0.883 | 0.915 | 0.932 | 0.927 | 0.905 | 0.864 |
| 1998 | 0.805 | 0.744 | 0.706 | 0.717 | 0.759 | 0.763 | 0.740 | 0.708 | 0.698 | 0.719 | 0.668 | 0.634 |
| 1999 | 0.634 | 0.618 | 0.705 | 0.805 | 0.796 | 0.787 | 0.828 | 0.887 | 0.922 | 0.913 | 0.936 | 0.950 |
| 2000 | 0.964 | 1.045 | 1.168 | 1.064 | 1.135 | 1.316 | 1.141 | 1.143 | 1.238 | 1.223 | 1.201 | 1.130 |
| 2001 | 1.154 | 1.157 | 1.108 | 1.221 | 1.395 | 1.198 | 1.035 | 1.203 | 1.246 | 0.954 | 0.845 | 0.742 |
| 2002 | 0.768 | 0.764 | 0.933 | 1.041 | 1.015 | 1.000 | 1.070 | 1.076 | 1.054 | 1.109 | 1.036 | 0.997 |
| 2003 | 1.070 | 1.243 | 1.284 | 1.133 | 1.101 | 1.117 | 1.142 | 1.280 | 1.232 | 1.183 | 1.127 | 1.099 |
| 2004 | 1.192 | 1.262 | 1.346 | 1.414 | 1.610 | 1.503 | 1.476 | 1.455 | 1.462 | 1.581 | 1.556 | 1.410 |
| 2005 | 1.401 | 1.494 | 1.671 | 1.735 | 1.638 | 1.706 | 1.830 | 2.115 | 2.384 | 2.167 | 1.834 | 1.753 |
| 2006 | 1.837 | 1.799 | 2.027 | 2.311 | 2.378 | 2.436 | 2.569 | 2.548 | 2.047 | 1.831 | 1.840 | 1.884 |
| - = No Data Reported; -- = Not Applicable; NA = Not Available; W = Withheld to avoid disclosure of individual company data. |
| Release Date: 6/1/2022 |
| Next Release Date: TBD |