|
Download Data (XLS File) |
|
||||||||
|
||||||||
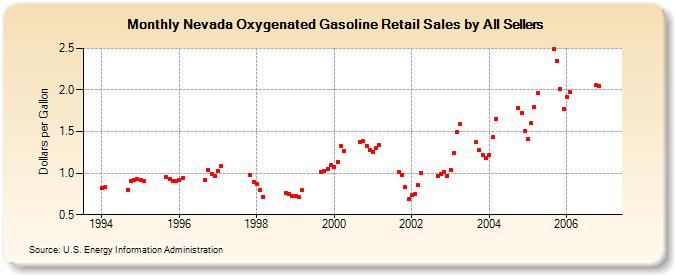
| Nevada Oxygenated Gasoline Retail Sales by All Sellers (Dollars per Gallon) | ||||||||
| Year | Jan | Feb | Mar | Apr | May | Jun | Jul | Aug | Sep | Oct | Nov | Dec |
|---|---|---|---|---|---|---|---|---|---|---|---|---|
| 1994 | 0.820 | 0.835 | W | W | W | W | W | W | 0.799 | 0.910 | 0.913 | 0.929 |
| 1995 | 0.921 | 0.902 | W | W | - | - | - | - | 0.952 | 0.925 | 0.910 | 0.903 |
| 1996 | 0.917 | 0.941 | NA | W | - | - | - | - | 0.919 | 1.041 | 0.988 | 0.964 |
| 1997 | 1.029 | 1.080 | NA | - | - | - | - | - | W | NA | 0.973 | 0.899 |
| 1998 | 0.873 | 0.798 | 0.717 | W | - | - | - | - | NA | 0.767 | 0.747 | 0.723 |
| 1999 | 0.727 | 0.712 | 0.792 | - | - | NA | - | - | 1.017 | 1.023 | 1.054 | 1.095 |
| 2000 | 1.069 | 1.138 | 1.327 | 1.267 | - | - | - | - | 1.378 | 1.381 | 1.331 | 1.277 |
| 2001 | 1.260 | 1.297 | 1.342 | W | - | - | - | - | 1.019 | 0.973 | 0.830 | 0.684 |
| 2002 | 0.732 | 0.754 | 0.852 | 1.001 | - | NA | - | - | 0.967 | 0.989 | 1.016 | 0.969 |
| 2003 | 1.043 | 1.242 | 1.489 | 1.596 | - | - | - | - | 1.371 | 1.277 | 1.220 | 1.182 |
| 2004 | 1.224 | 1.433 | 1.649 | W | - | - | - | - | W | 1.788 | 1.727 | 1.504 |
| 2005 | 1.407 | 1.599 | 1.801 | 1.963 | - | - | - | - | 2.495 | 2.346 | 2.009 | 1.775 |
| 2006 | 1.910 | 1.971 | W | W | - | - | - | - | W | 2.056 | 2.053 | NA |
| - = No Data Reported; -- = Not Applicable; NA = Not Available; W = Withheld to avoid disclosure of individual company data. |
| Release Date: 6/1/2022 |
| Next Release Date: TBD |