|
Download Data (XLS File) |
|
||||||||
|
||||||||
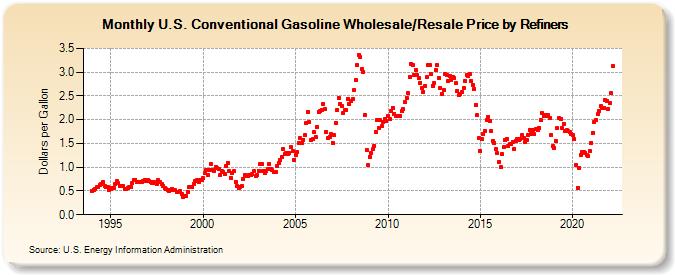
| U.S. Conventional Gasoline Wholesale/Resale Price by Refiners (Dollars per Gallon) | ||||||||
| Year | Jan | Feb | Mar | Apr | May | Jun | Jul | Aug | Sep | Oct | Nov | Dec |
|---|---|---|---|---|---|---|---|---|---|---|---|---|
| 1994 | 0.495 | 0.529 | 0.543 | 0.575 | 0.592 | 0.626 | 0.653 | 0.678 | 0.607 | 0.585 | 0.584 | 0.520 |
| 1995 | 0.550 | 0.564 | 0.572 | 0.646 | 0.701 | 0.657 | 0.600 | 0.598 | 0.601 | 0.550 | 0.543 | 0.562 |
| 1996 | 0.575 | 0.589 | 0.659 | 0.731 | 0.740 | 0.687 | 0.687 | 0.682 | 0.692 | 0.710 | 0.736 | 0.713 |
| 1997 | 0.729 | 0.703 | 0.682 | 0.673 | 0.691 | 0.661 | 0.655 | 0.724 | 0.681 | 0.641 | 0.613 | 0.571 |
| 1998 | 0.533 | 0.519 | 0.497 | 0.524 | 0.551 | 0.528 | 0.516 | 0.473 | 0.478 | 0.495 | 0.435 | 0.378 |
| 1999 | 0.403 | 0.387 | 0.481 | 0.579 | 0.579 | 0.580 | 0.653 | 0.704 | 0.733 | 0.690 | 0.727 | 0.731 |
| 2000 | 0.764 | 0.870 | 0.950 | 0.829 | 0.945 | 1.072 | 0.947 | 0.919 | 1.003 | 0.975 | 0.957 | 0.827 |
| 2001 | 0.914 | 0.900 | 0.858 | 1.020 | 1.098 | 0.915 | 0.779 | 0.877 | 0.912 | 0.692 | 0.598 | 0.567 |
| 2002 | 0.592 | 0.599 | 0.755 | 0.834 | 0.822 | 0.817 | 0.846 | 0.839 | 0.858 | 0.914 | 0.807 | 0.828 |
| 2003 | 0.918 | 1.068 | 1.066 | 0.930 | 0.887 | 0.913 | 0.952 | 1.062 | 0.960 | 0.934 | 0.900 | 0.906 |
| 2004 | 1.025 | 1.084 | 1.151 | 1.212 | 1.393 | 1.280 | 1.301 | 1.275 | 1.295 | 1.417 | 1.339 | 1.153 |
| 2005 | 1.266 | 1.317 | 1.511 | 1.612 | 1.503 | 1.581 | 1.671 | 1.923 | 2.170 | 1.942 | 1.564 | 1.596 |
| 2006 | 1.732 | 1.631 | 1.854 | 2.163 | 2.182 | 2.209 | 2.340 | 2.218 | 1.750 | 1.613 | 1.642 | 1.693 |
| 2007 | 1.518 | 1.673 | 1.934 | 2.213 | 2.465 | 2.336 | 2.288 | 2.146 | 2.196 | 2.206 | 2.442 | 2.331 |
| 2008 | 2.384 | 2.430 | 2.619 | 2.832 | 3.147 | 3.367 | 3.315 | 3.065 | 3.011 | 2.106 | 1.359 | 1.038 |
| 2009 | 1.222 | 1.295 | 1.373 | 1.454 | 1.742 | 1.993 | 1.828 | 1.986 | 1.864 | 1.944 | 2.020 | 1.973 |
| 2010 | 2.076 | 2.011 | 2.182 | 2.251 | 2.127 | 2.080 | 2.082 | 2.071 | 2.079 | 2.177 | 2.217 | 2.362 |
| 2011 | 2.457 | 2.560 | 2.903 | 3.179 | 3.142 | 2.935 | 3.042 | 2.938 | 2.871 | 2.780 | 2.669 | 2.587 |
| 2012 | 2.712 | 2.890 | 3.155 | 3.148 | 2.952 | 2.719 | 2.766 | 3.052 | 3.140 | 2.883 | 2.676 | 2.549 |
| 2013 | 2.627 | 2.970 | 2.943 | 2.806 | 2.915 | 2.839 | 2.903 | 2.875 | 2.763 | 2.606 | 2.512 | 2.536 |
| 2014 | 2.578 | 2.670 | 2.819 | 2.935 | 2.914 | 2.962 | 2.815 | 2.737 | 2.651 | 2.314 | 2.091 | 1.607 |
| 2015 | 1.335 | 1.588 | 1.700 | 1.766 | 1.987 | 2.065 | 1.975 | 1.763 | 1.553 | 1.513 | 1.373 | 1.290 |
| 2016 | 1.117 | 0.998 | 1.276 | 1.416 | 1.573 | 1.597 | 1.452 | 1.487 | 1.480 | 1.533 | 1.388 | 1.558 |
| 2017 | 1.593 | 1.577 | 1.583 | 1.671 | 1.605 | 1.520 | 1.573 | 1.671 | 1.786 | 1.698 | 1.773 | 1.690 |
| 2018 | 1.811 | 1.777 | 1.829 | 1.994 | 2.145 | 2.079 | 2.102 | 2.079 | 2.091 | 2.035 | 1.675 | 1.440 |
| 2019 | 1.409 | 1.552 | 1.817 | 2.035 | 2.012 | 1.826 | 1.917 | 1.755 | 1.773 | 1.766 | 1.738 | 1.694 |
| 2020 | 1.668 | 1.590 | 1.054 | 0.572 | 0.984 | 1.256 | 1.324 | 1.329 | 1.301 | 1.259 | 1.228 | 1.342 |
| 2021 | 1.519 | 1.728 | 1.957 | 1.995 | 2.112 | 2.184 | 2.282 | 2.241 | 2.251 | 2.421 | 2.391 | 2.215 |
| 2022 | 2.346 | 2.554 | 3.123 | |||||||||
| - = No Data Reported; -- = Not Applicable; NA = Not Available; W = Withheld to avoid disclosure of individual company data. |
| Release Date: 6/1/2022 |
| Next Release Date: TBD |