|
Download Data (XLS File) |
|
||||||||
|
||||||||
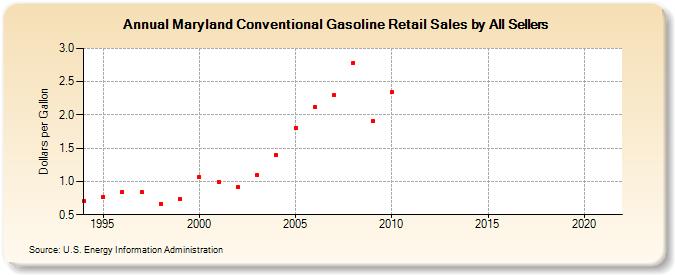
| Maryland Conventional Gasoline Retail Sales by All Sellers (Dollars per Gallon) | ||||||||
| Decade | Year-0 | Year-1 | Year-2 | Year-3 | Year-4 | Year-5 | Year-6 | Year-7 | Year-8 | Year-9 |
|---|---|---|---|---|---|---|---|---|---|---|
| 1990's | 0.703 | 0.767 | 0.848 | 0.842 | 0.666 | 0.734 | ||||
| 2000's | 1.068 | 0.999 | 0.918 | 1.094 | 1.398 | 1.810 | 2.121 | 2.299 | 2.785 | 1.906 |
| 2010's | 2.338 | - | - | - | - | - | - | - | - | - |
| 2020's | - |
| - = No Data Reported; -- = Not Applicable; NA = Not Available; W = Withheld to avoid disclosure of individual company data. |
| Release Date: 6/1/2022 |
| Next Release Date: TBD |